Download
1 / 3
30 likes | 117 Views
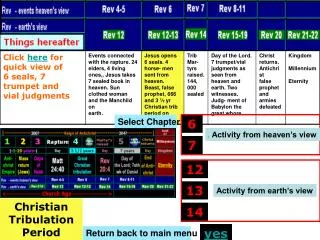
Explore the data from PPT3LabSea 2009 through select histograms to gain valuable insights. This study delves into the distribution patterns and trends depicted in the histograms, offering a deeper understanding of the information presented. By analyzing these histograms, you can uncover underlying relationships and draw meaningful conclusions from the data. Join us on this analytical journey to discover key findings from the PPT3LabSea 2009 dataset.

E N D