Download
1 / 24
240 likes | 389 Views
General Information about the Test 50 MC questions 7 from book sections not touched on in class: major ideas and findings, not specific names of researchers (e.g., “Ambady and Rosenthal found that judgments of teacher behavior . . . could also be used to predict teacher effectiveness”)

E N D
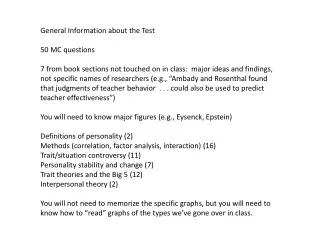
General Information about the Test 50 MC questions 7 from book sections not touched on in class: major ideas and findings, not specific names of researchers (e.g., “Ambady and Rosenthal found that judgments of teacher behavior . . . could also be used to predict teacher effectiveness”) You will need to know major figures (e.g., Eysenck, Epstein) Definitions of personality (2) Methods (correlation, factor analysis, interaction) (16) Trait/situation controversy (11) Personality stability and change (7) Trait theories and the Big 5 (12) Interpersonal theory (2) You will not need to memorize the specific graphs, but you will need to know how to “read” graphs of the types we’ve gone over in class.
Correlation: r = -.29 Effect of restricting range
The relationship between x and y depends on z: “Interaction” Interactionism in personality: The relationship between p and behavior depends on the situation
The relationship between x and y depends on z: “Interaction”
How does the matrix data turn into factor data? The numbers on the graph of correlations are different from the numbers that appear on the structure matrix where you have the factors. Why do they change? I was just wanting you to go over the correlational matrix and how to get the main factors from the matrix because I really do not understand how to read the correlational and factor matrix.
1 2 3 4 5 6 7 • I did what had to be done - .10 .75 -.05 .03 .12 .00 • 2. I learned to live with it - -.02 .52 .61 -.07 -.08 • 3. I tried to get rid of it - .17 .00 .09 .15 • 4. I accepted that it was there - .71 .11 .08 • 5. I tried to see it in a different light - .06 -.04 • 6. I slept more than usual - .59 • 7. I daydreamed about other things -
Factor: A B C D 1. I did what had to be done .62 .15 .01 -.12 2. I learned to live with it .03 -.08 .49 .08 3. I tried to get rid of it .54 .04 -.20 .16 4. I accepted that it was there .10 .11 .56 .03 5. I tried to see it in a different light .07 .08 .50 .02 6. I slept more than usual -.02 .72 .12 -.13 7. I daydreamed about other things .08 .48 .08 .08
Concerning the table displaying the correlations of OCEAN scores at 6 six years ago and present, why aren't the spouses' ratings of C and A present? Was there not enough information to calculate the correlations?
MODEL 1 Personality traits do not change: Correlations (p. 49) Over 6 years . . . Men Women Spouses O .81 .73 .80 C .76 .71 E .86 .73 .77 A .59 .55 N .81 .81 .83 The most open, conscientious, extraverted, agreeable, and neurotic people will also tend to be highest on those personality traits 6 years later . . . at least, that’s the way they see themselves . . . are spousal ratings any better? Consistency also increases with age throughout the adult lifespan and peaks at around age 50: cumulative continuity principle
Does the big 5 test allow us to make accurate predictions about future behavior and behavior in certain circumstances/situations?
* r = -.23
Equals 85 fewer deaths among patients of 10,845 study physicians (OR 5,408 deaths among all 690,000 US physicians)
Could we review the differences between reactive interactions, evocative interactions and proactive interactions and their types of correlations along with the corresponsive principle?
People and their environments: 3 kinds of interaction People react differently to their environments “reactive” interaction same as statistical interaction Environments react differently to people “evocative” interaction same as statistical interaction People select their environments “proactive” interaction This last kind of interaction is not the same as statistical interaction; creates a correlation between personality and the environment (main effect).
Do we need to know the 16 factors that are associated with the big 5? NO What was the purpose for Hans Eysenck to create the "3rd Dimension" Psychoticism? Observation + factor analysis + a physical substrate (testosterone and MAO)