Download
1 / 29
290 likes | 443 Views
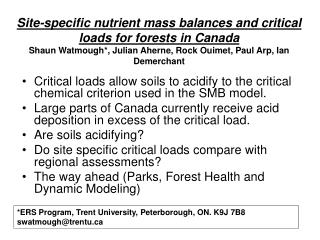
Site-specific nutrient mass balances and critical loads for forests in Canada Shaun Watmough*, Julian Aherne, Rock Ouimet, Paul Arp, Ian Demerchant. Critical loads allow soils to acidify to the critical chemical criterion used in the SMB model.

E N D
Site-specific nutrient mass balances and critical loads for forests in CanadaShaun Watmough*, Julian Aherne, Rock Ouimet, Paul Arp, Ian Demerchant • Critical loads allow soils to acidify to the critical chemical criterion used in the SMB model. • Large parts of Canada currently receive acid deposition in excess of the critical load. • Are soils acidifying? • Do site specific critical loads compare with regional assessments? • The way ahead (Parks, Forest Health and Dynamic Modeling) *ERS Program, Trent University, Peterborough, ON. K9J 7B8 swatmough@trentu.ca
1. Are Soils Acidifying? • Base Cation (and S and N) mass balances conducted for 21 sites in Canada, eastern United States and Europe.
Site Mass Balances: Contributing Authors: Shaun A. Watmough, Julian Aherne, Christine Alewell, Paul Arp, Scott Bailey, Tom Clair, Peter Dillon, Louis Duchesne, Catherine Eimers, Ivan Fernandez, Neil Foster, Thorjorn Larssen, Eric Miller, Myron Mitchell, Stephen Page. Funded by NERC
Mass Balances • Mass Balance = Input – Output • Inputs = deposition + (mineral weathering) • Outputs = stream export
Deposition Net forest uptake Weathering Soil calcium pool Soil leaching losses
Sulphate Deposition Annual sulphate deposition (1990s) was between 7.3 and 28.4 kg/ha (excluding WF). No notable differences between Canada, US and Europe.
Nitrogen Deposition Annual N deposition (1990s) was between 2.8 kg/ha and 13.7 kg/ha (excluding WF). Nitrogen deposition was generally higher at the European sites where a greater proportion of the annual N deposition was as NH4.
Calcium Deposition Annual Ca deposition (1990s) was between 0.8 kg/ha and 4.2 kg/ha. Calcium deposition was highest at the eastern Canadian and central European sites.
The majority of N is retained: Between 31 and 100% of inorganic N input in deposition was retained across the study sites; median retention of 94%
Estimates of base cation weathering: aEstimated using the PROFILE model (version 4.0; Warfvinge and Sverdrup 1992).
Mass balances including weathering: Ca and Mg export exceeded inputs at 14/18 and 10/18 sites respectively: Calcium Annual Ca and Mg losses represent appreciable proportions of the current exchangeable soil Ca and Mg pools, although losses at some of the sites likely occur from weathering reactions beneath the rooting zone. There is also considerable uncertainty associated with mineral weathering estimates. Magnesium
Mass balances including weathering: Inclusion of mineral weathering balances K and Na budgets (i.e. deposition + weathering ≥ export) at 16/18 and 10/18 sites, respectively: Potassium Sodium
Conclusions • Mass Balance Studies indicated that base cation losses are occurring at the majority of sites. • Sulphate export generally exceeds sulphate deposition (is it all dry deposition?) • Losses are occurring despite the fact that 31 -100 % of the N is currently retained (not the assumption of the SMB model)
< 250 250–500 500–750 750–1000 > 1000 Critical loads (eq ha–1 yr–1)
What are the critical loads for Parks? • An example with the Kawartha Highlands Park in Ontario (The First Steps).
Forest health plot Survey lake < 250 250–500 500–750 750–1000 > 1000 Critical loads (eq ha–1 yr–1) Pencil lake (3337) Bottle lake (833) Loon call lake (1162) Cavendish lake (McGinnis) (1265) Litte horse shoe lake (5675)
Forest health plot > 400 (EXC) 100–400 (EXC) 0–100 (EXC) -100–0 (no EXC) < -100 (no EXC) Exceedance (eq ha–1 yr–1)
The Next Steps • More Detailed Site Specific Data (MOE Plots, MNR Plots, CWS, Surface Water Chemistry). • Ground-Truth Maps. • Target Sampling. • Link to Forest (Ecosystem) Health. • Dynamic Approach (combining surface water/soil data). • Include Disturbance in Dynamic Scenarios.
Historic reconstruction Observed Forecast Husar (1994), Lefohn et al. (1999) EPA (2000) Kaminski (2002) 2.0 1.5 Deposition Sulphate deposition scale factor 1.0 Lake ANC (acid neutralizing capacity) increases in response to reduced deposition, but will start to slowly decline again as soil base saturation decreases Soil base saturation continues to decline, despite large reductions 0.5 150 35 30 133 25 117 20 Median lake ANC (µmolc L–1) Median soil base saturation (%) 100 15 83 10 67 5 50 0 1850 1875 1900 1925 1950 1975 2000 2025 2050
Exeedance (eq ha –1 yr –1) exceedance > 100 exceedance 0–100 no exceedance 0–100 no exceedance > 100 Forest health monitoring plots
Relationship between exceedance of the critical load and forest health Regression excluding 5 sites 1989 5 sites were mis-classified (yellow dots on the previous slide)– soil data indicated high weathering potential
Forests are not at steady state and disturbances such as harvesting or fire must be considered.
The Ca dynamics of Fire Effect of forest fire on stream Ca and SO4 concentration at Rawson lake (NW basin; S. Page, unpublished data)
Conclusions • General agreement with regional maps and site specific data. • Maps may be used to highlight potentially sensitive areas (target sampling). • Mass balance estimates at 18 sites indicate that soils are acidifying at the majority of sites, despite the fact that N is currently retained. • Dynamic models have much potential, but require more data and the issue of uncertainty with respect to N and disturbance remains. • Link to forest health?