Download
1 / 14
140 likes | 298 Views
Class 06. 07. Case: The Roulette Wheel Goodness of Fit Tests. EMBS 11.2. What we learned last class. Probability Distributions have characteristics Descriptive Statistics are used to estimate those characteristics. Location (mean, median, mode)

E N D
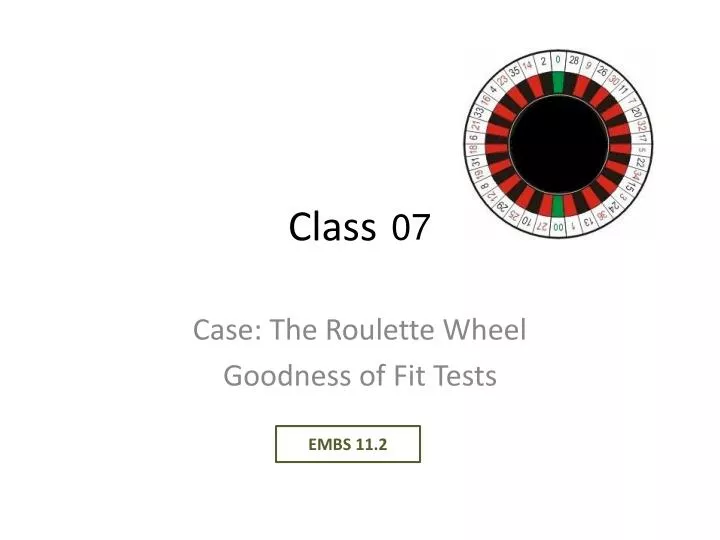
Class 06 07 Case: The Roulette Wheel Goodness of Fit Tests EMBS 11.2
What we learned last class • Probability Distributions have characteristics • Descriptive Statistics are used to estimate those characteristics. • Location (mean, median, mode) • Variability (variance and standard deviation) • Shape (skewness) • The MEAN is important. • Sample mean “value” times n is total value. • Measures of variability are under-appreciated
Baseball Statistics • A batter came to the plate five times • Got a hit • Struck Out • Walked • Flied Out • Grounded Out WALK is the fault of the pitcher: 1 success in 4 trials Batting Average = ¼ = 0.250 WALK is the fault of the batter: 2 successes in 5 trials On Base Percentage = 2/5 = 0.400
The Roulette wheel. • Surveillance video of 18 hours of play of a roulette wheel in a Reno, Nevada casino • 904 spins of the wheel • 22,527 bets places
First We Examine the Wheel • H0: The wheel works properly • H0: All 38 outcomes have equal probability of occurring • H0: P0=P28=P9=…=P2=1/38 • HA: they are not all equal Like before, the Hypothesis is about a parameter of a probability distribution
Goodness-of-fit Test Calculate the expected counts under H0 Calculate the Distances as (O-E)2/E The sum of the distances is the test statistic. We call it the calculated chi-squared. We reject H0 (and say the results are statistically significant) if the calculated chi-squared statistic is too big. The calculated chi-squared statistic The sum of the distances.
We need a p-value! Number correct depends on n and P • For the lady tasting tea P(X≥8 │ H0) = 1-binomdist(7,10,.5,true) Pvalue = 0.055 • For a GOODNESS OF FIT TEST P(χ2≥ calculated χ2 │H0) = chidist(calculated χ2, dof) dof stands for “degrees of freedom” dof is the parameter of the chi-squared distribution dof here is 37, the number of cells - 1. P(χ2≥ 31.2│H0) = chidist(31.2,37) Pvalue = 0.74 χ2 depends on number of cells - 1. Can also use =chisq.dist.rt(31.2,37) NOT statistically significant.
WARNING • The chi-squared test does not work well when some cells have low expected counts. • If some cells have expected counts < 5, combine then with neighboring cells.
Roulette Wheel Demonstration H0: All 38 are equally likely to get bet on. Ha: The p’s are not equal. (Some segments are more popular than others)
LorexPharma H0: The Fill Amounts are Normally Distributed with μ=10.2 and σ=0.16 Ha: They are not…
Assignment 08 • Due Monday, Feb 13 • Youth Soccer (football) teams from several countries compete annually in an important international tournament. • The birth months (Jan=1, Feb=2, .. Dec=12) of the 288 boys competing in the 2005 under 16 division showed higher counts for the early months and lower counts for the later months. • Formulate and test a relevant hypothesis • If you find statistical significance, offer an option about how it came to be that early months are more prevalent. opinion Helsen, W.F., Van Winckel, J., and WIlliams, M., The relative age effect in youth soccer across Europe, Journal of Sports Sciences, June 2005; 23(6): 629-636.
The Data look like….. http://faculty.darden.virginia.edu/Pfeiferp/Statisticsinbusiness/assignments.htm