Functional Imaging Study of Central Post-Stroke Pain in Rats
This study investigates the functional brain changes associated with Central Post-Stroke Pain (CPSP) in a rat model. Stroke is a leading cause of disability, with over 8% of victims developing CPSP after six months. We focus on the role of the thalamus and related circuits, considering recent hypotheses including central disinhibition and cerebral sensitization. Using [14C]-iodoantipyrine as a radiotracer, we analyze functional imaging data to reveal altered brain activity post-stroke. Our findings aim to shed light on CPSP mechanisms and guide future therapeutic strategies.

Functional Imaging Study of Central Post-Stroke Pain in Rats
E N D
Presentation Transcript
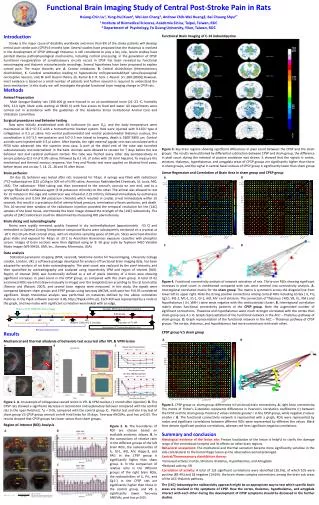
Functional Brain Imaging Study of Central Post-Stroke Pain in Rats Hsiang-Chin Lu1, Yung-Hui Kuan1, Wei-Jen Chang1, Andrew Chih-Wei Huang2, Bai Chuang Shyu1* 1 Institute of Biomedical Sciences, Academia Sinica, Taipei, Taiwan, ROC 2 Department of Psychology, FoGuang University, Yilan, Taiwan, ROC Bregma +2.70mm Bregma +2.20mm Bregma +1.70mm Bregma +1.20mm Bregma -2.30mm Bregma -2.56mm Introduction Stroke is the major cause of disability worldwide and more than 8% of the stroke patients will develop central post-stroke pain (CPSP) 6 months later. Several studies have proposed that the thalamus is involved in the development of CPSP. Although thalamus is still considered to play a key role, recent studies have pointed diverse pathophysiological mechanisms, including cortical processing, in the generation of CPSP. Functional reorganization of somatosensory circuits occurs in CPSP has been revealed by functional neuroimaging and thalamic microelectrode recordings. Several hypotheses have been proposed to explain central pain. The major theories are: A. Central imbalance, B. Central disinhibition (thermosensorydisinhibition), C. Cerebral sensitization leading to hyperactivity or/hyperexcitabilityof spinal/supraspinal nociceptive neurons, and, D. Grill illusion theory. (G. Kumar & C. R. Soni. J. Neurol. Sci. 284 (2009)) However, most evidence is based on a small number of patients and further research is required to understand the basic mechanism. In this study, we will investigate the global functional brain imaging change in CPSP rats. Functional Brain Imaging of C-14 Iodoantipyrine Bregma -3.30mm Bregma -3.60mm Bregma -4.80mm Bregma -5.20mm Methods Animal Preparation Male Sprague-Dawley rats (300-400 g) were housed in an air-conditioned room (21–23 oC, humidity 50%, 12-h light /dark cycle starting at 08:00 h) with free access to food and water. All experiments were carried out in accordance with the guidelines of the Academia Sinica Institutional Animal Care and Utilization Committee. Surgical procedures and Behavior testing Rats were initially anesthetized with 4% isoflurane (in pure O2), and the body temperature were maintained at 36.5~37.5°C with a homeothermic blanket system. Rats were injected with 0.125U type 4 collagenase in 0.5 ml saline into ventral posteromedial and ventral posteromedial thalamus nucleus, the coordination is 3.0~3.5 mm posterior and 3.0~3.5 mm lateral to bregma, depth is 5500~5800 mm. Control animals were injected with 0.5 ml saline. After 4weeks, the right external jugular vein was cannulated with a PE50 tube advanced into the superior vena cava. A port at the distal end of the tube was tunneled subcutaneously and externalized in the back. Animals were allowed to recover for 7 days before the last behavior test and cerebral perfusion started. The tube was flushed every other day postoperatively to ensure patency (0.3 ml of 0.9% saline, followed by 0.1 mL of saline with 20 U/ml heparin). To measure the mechanical and thermal noxious response, Von Frey and Plantar test were applied on bilateral hind paws, before lesion and on day 7, 14, 21, 28 and 35 after lesion. Brain perfusion On day 35, behavior was tested after rats recovered for 7days. A syringe was filled with radiotracer [14C]-iodoantipyrine (125 mCi/kg in 300 ml of 0.9% saline, American Radiolabelled Chemicals, St. Louis, MO, USA). The radiotracer- filled tubing was then connected to the animal’s cannula on one end, and to a syringe filled with euthanasia agent (3 M potassium chloride) on the other. The animal was allowed to rest for 15 minutes in the cage and radiotracer was infused at 2.25 ml/min, followed immediately by euthanasia (4% isoflurane and 0.5ml 3M potassium chloride) which resulted in cardiac arrest immediately within 10 seconds, this result in a precipitous fall of arterial blood pressure, termination of brain perfusion, and death. This 10-second time window of the radiotracer injection provided the temporal resolution for the [14C] uptakes of the brain tissue, and thereby the brain image showed the strength of the [14C] radioactivity. The uptake of [14C] radiotracer could be determined by measuring ROI pixel intensity.. Brain slicing and autoradiography Brains were rapidly removed, quickly frozened in dry ice/methylbutane (approximately -55 C) and embedded in Optimal Cutting Temperature compound Brains were subsequently sectioned on a cryostat at -20°C into 20-mm-thick coronal slices, with an interslice sampling space of 240 mm. Slices were heat-dried on glass slides and exposed for 4days at -20°C to Anersham Biosciences exposure cassettes with phosphor screen. Images of brain sections were then digitized using an 8- bit gray scale by Typhoon 9410 Variable Mode Imager (WS-S9410, GMI, Inc., Ramsey, Minnesota, USA). Data analysis Statistical parametric mapping (SPM, version8, Wellcome Centre for Neuroimaging, University College London, London, UK), a software package developed for analysis of functional brain imaging data, has been adapted for analysis of rat brain autoradiography. The pixel count was replaced by the pixel intensity, and then quantified by autoradiography and analyzed using respectively SPM and region of interest (ROI). Region of interest (ROI) was functionally defined as a set of pixels intensity of a brain area showing significant increases in pixel count in the CPSP group, as compared with the sham group. A total of 62 anatomical ROIs were first drawn manually in ImageJ over the template brain according to the rat brain atlas (Paxinos and Watson, 2007), and several brain regions were measured. In this study, the signals were compared between sham groups and CPSP groups using two-way ANOVA, with post hoc P<0.05 considered significant. Graph theoretical analysis was performed on networks defined by the above correlation matrices in the Pajek software (version 3.06, http://Pajek.imfm.si/). Each ROI was represented by a node in the graph, and two nodes with significant correlation were linked with an edge. Figure 3. Key brain regions showing significant differences in pixel count between the CPSP and the sham groups. The results were obtained by differential subtraction between CPSP and sham group, the difference in pixel count during the retrieval of passive avoidance was shown. It showed that the signals in cortex, striatum, thalamus, hypothalamus, and amygdala areas of CPSP groups are significantly higher than those in sham groups, and the signal in ventral basal nucleus of CPSP group is significantly lower than sham group. Linear Regression and Correlation of Brain Area in sham group and CPSP group B A C D Figure 4. Functional connectivity analysis of network activation of rats. Thirty-one ROIs showing significant increases in pixel count in conditioned compared with rats were entered into connectivity analysis. A. Interregional correlation matrix for the sham group. The matrix is symmetric across the diagonal line from lower left to upper right. Note the strong positive connections among cortical ROIs including Cortex ( IL, PrL, Cg1-1, M2-1, M1-1, S1-1, GI-1, AID, AIV ) and striatum. The connection of Thalamus ( MD, VB, VL, VM ) and hypothalamus ( LH, VMH ) were weak negative with this corticostriatal cluster. B. Interregional correlation matrix shows functional connectivity patterns of the CPSP group. Note the augmented number of significant connections. Thalamus and hypothalamus were much stronger correlated with the cortex than sham group (see A ). C. Graph representation of the functional network in the ACC – Thalamus pathway of sham groups. D. Graph representation of the functional network in the ACC – Thalamus pathway of CPSP groups. The cortex, thalamus, and hypothalamus had more connections with each other.. Sham vs CPSP (VPM/VPL hemorrhage) Connect PE50 tube and start injection Connect PE50 tube distally to the jugular vein Euthanasia 5 min 10 sec 1 min W1 W2 W3 W4 W5 Heparin ( 20U/ml), 0.1mL/day Injection of 14C-IAP Pre-lession behavioral assessment Decapitate OCT embedding Brain slice Behavioral assessment CPSP group V.S sham group Results Mechanical and thermal allodynia of behaviors test occurred after VPL & VPM lesion A B A B C Figure 1. A. An example of collagenase caused lesion in VPL & VPM nuclear. (1 month after injection). B. The CPSP rats showed a significant decrease in locomotion and exploratory behavior compared with the control rats in the open field test. *p < 0.05, compared with the control group. C. Plantar test and Von Fray test of sham group V.S CPSP group animals on left hind limbs for 35 days. Two-way ANOVAs, post hoc p<0.05. The results showed that CPSP groups has lower values than sham groups. Figure 5. CPSP group vs. sham group: differences in functional brain connectivity. A. right brain connectivity: The matrix of Fisher's Z-statistics represents differences in Pearson's correlation coefficients (r) between the CPSP and the sham group. Positive Z values indicate greater r in the CPSP group, while negative Z values smaller r. B. The functional connectivity network is represented with a graph, ROIs were represented by nodes and significant correlations between different ROIs were represented by different line values. Black lines denote significant positive correlations, whereas red lines significant negative correlations. Region-of-Interest (ROI) Analysis Figure 2. A. The boundaries of ROI are chosen based on available anatomic atlases. B. In the comparison of relative ratio in the different groups of the left brain ROIs, the radioactivities of IL, GI-1, AID, AIV, Hippo-3, and PAG in the CPSP group is significantly higher than sham group. C. In the comparison of relative ratio in the different groups of the right brain ROIs, the radioactivities of IL, PrL, and Cg1-1 in the CPSP rats are significantly higher than those in the control group, and VB is significantly lower. Two-way ANOVAs, post hoc p<0.05. • Summary and conclusion • Histological evidence of the lesion site: Precise localization of the lesion is helpful to clarify the damage range of the ventrobasal complex and its effects on other brain regions. • Behavioral assessment: The mechanical and thermal sensation became more significantly sensitive in the side contralateral to the hemorrhagic lesion as the observation period prolonged. • Central/Thermosensory disinhibition theory: • Increased activity: Cortex, Striatum, thalamus, Hypothalamus, and Amygdala. • Reduced activity: VB • Correlation of activity: A total of 123 significant correlations were identified (26.5%), of which 105 were positive (85.4%) and 18 negative (14.6%). the brain shows complex connections among the brain sub areas of the ACC-thalamic pathway. • The [14C]-iodoantipyrine radioactivity approach might be an appropriate way to test which specific brain areas are involved in the symptoms of CPSP. How the cortex, thalamus, hypothalamus, and amygdala interact with each other during the development of CPSP symptoms should be discussed in the further studies. M1-2 M2-2 M2-1 Cg1-2 M1-1 Cg1-1 Cg2 S1-2 PrL S1-1 striatum GI-2 GI-1 IL AID AIV S1-4 S1-3 Hippo-1 Hippo-2 MD VB VL VM LH Amygdala-1 Amygdala-2 VMH cerebellum Hippo-3 PAG A: Mean of the ROI B: Mean of the selected background region R: Mean of the reference ROI (Cerebellum)