Download
1 / 16
160 likes | 189 Views
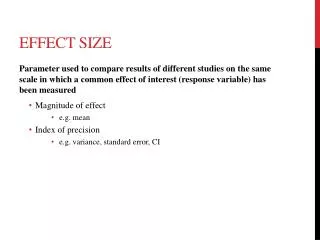
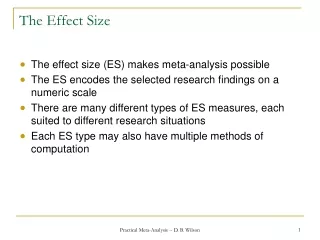
Learn about different ways to calculate effect sizes in meta-analysis such as mean difference and correlations for data analysis.

E N D
Meta-analysis weights • Meta-analysis takes an average • Unit weights (unweighted average; w=1) (Bonett) • Sample size weights (w = N) (Schmidt & Hunter) • Inverse variance weights (w = 1/V) (Hedges & Olkin) • There are arguments in favor of each. We will mostly focus on inverse variance weights.
Single Variable Effect Sizes • Use for central tendency • E.g., what is the graduation rate from college? • What is the time to complete college? • What is the proportion of female college graduates?
Proportion (Direct) ES = Effect size. P is the proportion of things of interest. e.g., p = proportion field goals made from less than 40 yards. Precision:
Proportion (Logit) Logit has nice statistical properties. Precision
Aritmethic Mean e.g., mean achievement test score. Precision
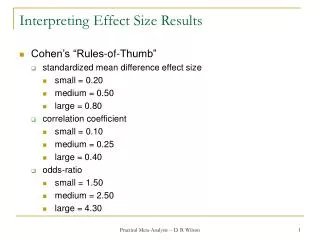
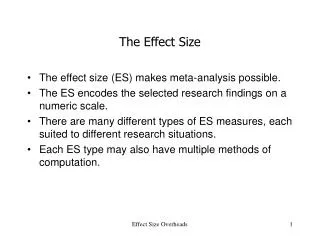
Conventional Effect Sizes Most effect sizes show the relations between two variables, either a difference between groups (IV) on some criterion of interest (DV), such as d, the standardized mean difference, or an association between two continuous variables (e.g., the correlation), or between two categorical variables (e.g. odds ratios).
Mean Difference (Unstandardized) Used ONLY if measures are the same across all studies (e.g., used the Beck Depression Inventory to study the effectiveness of a treatment for depression (experimental vs. control group design).
Mean Difference (Standardized) Spooled is the pooled Standard deviation. Note that the variance of d depends upon the magnitude of d (actually delta, estimated by d). The estimated standard deviation in Excel is stdev.s. Example: =stdev.s(a1:a10)
Denominators of d and t This is the pooled standard deviation –within group SD, the yardstick for computing d. This is the standard error of the difference between means. This is the yardstick for the independent samples t-test. Which will show a larger difference between group means?
Mean Difference(Standardized) Bias correction: Formulas from Borenstein et al., 2009, p. 27 The effect size d is sometimes called ‘Cohen’s d’ and the effect size g is sometimes called ‘Hedges’g’ but in practice they are essentially the same. It is now conventional to use g.
Correlation (Pearson’s r) Fisher’s r to z transformation. The Excel function for correlation is correl(rangeX, rangeY). Example: =correl(a1:a10, b1:10). The r to z in Excel is =atanh(correlation) e.g., =atanh(c11).
Class Exercise 1a Compute Cohen’s d for these data. Compute Hedges’ g for these data. I would use Excel if I were you.
Class Exercise 1b Compute the correlation coefficient r for these data (note the data are the same as exercise 1a, but we have only one group of people and two variables. Compute Fisher’s z for these data.