Ideas
This project involves developing a comprehensive database and dashboard focused on behavioral observation data. By employing machine learning algorithms, we analyze accelerometer data to identify and learn behavioral patterns, measuring the frequency of specific interactions. The goal is to improve student engagement in online courses through effective data collection and integration. Additionally, the project includes converting scanned charts and video annotations into quantified data, paving the way for advanced analytics in online learning environments.

Ideas
E N D
Presentation Transcript
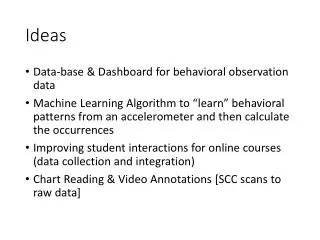
Ideas • Data-base & Dashboard for behavioral observation data • Machine Learning Algorithm to “learn” behavioral patterns from an accelerometer and then calculate the occurrences • Improving student interactions for online courses (data collection and integration) • Chart Reading & Video Annotations [SCC scans to raw data]