Download
1 / 36
360 likes | 496 Views
Information Visualization Tools Dr. Katy Börner Cyberinfrastructure for Network Science Center Information Visualization Laboratory School of Library and Information Science Indiana University, Bloomington, IN http://cns.iu.edu

E N D
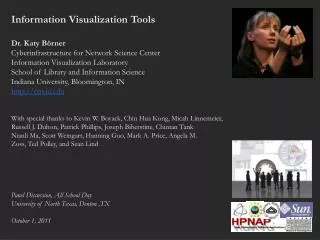
Information Visualization Tools Dr. Katy Börner Cyberinfrastructure for Network Science Center Information Visualization Laboratory School of Library and Information Science Indiana University, Bloomington, IN http://cns.iu.edu With special thanks to Kevin W. Boyack, Chin Hua Kong, Micah Linnemeier, Russell J. Duhon, Patrick Phillips, Joseph Biberstine, Chintan Tank Nianli Ma, Scott Weingart, Hanning Guo, Mark A. Price, Angela M. Zoss, Ted Polley, and Sean Lind Panel Discussion, All School Day University of North Texas, Denton ,TX October 1, 2011
Börner, Katy. (March 2011). Plug-and-Play Macroscopes. Communications of the ACM, 54(3), 60-69. Video and paper are at http://www.scivee.tv/node/27704 2
Sci2 Tool: Download, Install, and Run Sci2 Tool v0.5.1 Alpha (May 4th, 2011) Can be freely downloaded for all major operating systems from http://sci2.cns.iu.edu Select your operating system from the pull down menu and download. Unpack into a /sci2 directory. Run /sci2/sci2.exe Sci2 Manual is at http://sci2.wiki.cns.iu.edu Cite as Sci2 Team. (2009). Science of Science (Sci2) Tool. Indiana University and SciTech Strategies, http://sci2.cns.iu.edu .
OSGi/CIShell powered tool, see http://cishell.org http://sci2.cns.iu.edu | http://sci2.wiki.cns.iu.edu Börner, Katy, Huang, Weixia (Bonnie), Linnemeier, Micah, Duhon, Russell Jackson, Phillips, Patrick, Ma, Nianli, Zoss, Angela, Guo, Hanning & Price, Mark. (2009). Rete-Netzwerk-Red: Analyzing and Visualizing Scholarly Networks Using the Scholarly Database and the Network Workbench Tool. Proceedings of ISSI 2009: 12th International Conference on Scientometrics and Informetrics, Rio de Janeiro, Brazil, July 14-17 . Vol. 2, pp. 619-630. Open Code for Replicable S&T Assessment Sci Maps GUESS Network Vis Horizontal Time Graphs 6
Sci2 Tool Geo Maps Circular Hierarchy 7
Network Extraction: Examples Author co-occurrence network Paper-author 2-mode network 8
Sci2 Tool Interface ComponentsSee also http://sci2.wiki.cns.iu.edu/2.2+User+Interface Use Menu to read data, run algorithms. Console to see work log, references to seminal works. Data Manager to select, view, save loaded, simulated, or derived datasets. Scheduler to see status of algorithm execution. All workflows are recorded into a log file (see /sci2/logs/…), and soon can be re-run for easy replication. If errors occur, they are saved in a error log to ease bug reporting. All algorithms are documented online; workflows are given in tutorials, see Sci2 Manual at http://sci2.wiki.cns.iu.edu
Network Visualization: Giant Component .......... Weak Component Clustering was selected. Implementer(s): Russell Duhon Integrator(s): Russell Duhon Input Parameters: Number of top clusters: 10 3 clusters found, generating graphs for the top 3 clusters. .......... 13
Network Visualization: Color/Size Coding by Degree .......... Node Degree was selected. Documentation: https://nwb.slis.indiana.edu/community/?n=AnalyzeData.NodeDegree .......... 14
Network Visualization: Color/Size Coding by Betweeness Centrality .......... Node Betweenness Centrality was selected. Author(s): L. C. Freeman Implementer(s): Santo Fortunato Integrator(s): Santo Fortunato, Weixia Huang Reference: Freeman, L. C. (1977). A set of measuring centrality based on betweenness. Sociometry. 40:35-41. Input Parameters: Number of bins: 10 umber of bins: 10 .......... 15
Network Visualization: Reduced Network After Pathfinder Network Scaling .......... MST-Pathfinder Network Scaling was selected. Input Parameters: Weight Attribute measures: SIMILARITY Edge Weight Attribute: weight .......... 16
Network Visualization: Circular Hierarchy Visualization Select Co-Author Network and run Blondel Community detection: With parameter values 17
Network Visualization: Circular Hierarchy Visualization Node labels, e.g., author names. Network structure using edge bundling. Color coded cluster hierarchy according to Blondel community detection algorithm. Nodes that are interlinked/clustered are spatially close to minimize the number of edge crossings. Note: Header/footer info, legend, and more meaningful color coding are under development. 18
Topic Mapping: UCSD Science Map Data: WoS and Scopus for 2001–2005, 7.2 million papers, more than 16,000 separate journals, proceedings, and series Similarity Metric: Combination of bibliographic coupling and keyword vectors Number of Disciplines: 554 journal clusters further aggregated into 13 main scientific disciplines that are labeled and color coded in a metaphorical way, e.g., Medicine is blood red and Earth Sciences are brown as soil. 19
How to Read the UCSD Map Circle of non-located, e.g., ‘Unclassified’ records. Header and footer with information when this map was created, by whom and using what data set. Listing and circle of non-located, e.g., ‘Unclassified’ records. UCSD Science Map with data overlay. Map legend of circle area size coding Listing of all data records organized into UCSD science areas. 20
Geospatial maps with congressional districts Identify Congressional District, Latitude, Longitude Aggregate/Count identical Congressional Districts 21
How to Read the Geo Map Header and footer with information when this map was created, by whom and using what data set. Map legend with color coding. U.S. Map with data overlay. Listing of map type, author, and parameters used. 22
Evolving collaboration networks Load isi formatted file As csv, file looks like: Visualize each time slide separately: 24
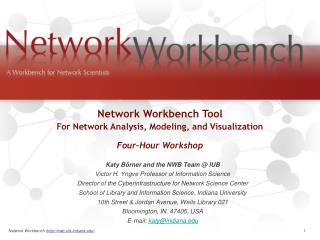
Scholarly Database at Indiana Universityhttp://sdb.wiki.cns.iu.edu Supports federated search of 25 million publication, patent, grant records. Results can be downloaded as data dump and (evolving) co-author, paper-citation networks. Register for free access at http://sdb.cns.iu.edu
Since March 2009:Users can download networks: - Co-author - Co-investigator - Co-inventor - Patent citationand tables for burst analysis in NWB. 27
CIShell – Integrate New Algorithms CIShell Developer Guide is at http://cishell.wiki.cns.iu.edu Additional Sci2 Plugins are athttp://sci2.wiki.cns.iu.edu/3.2+Additional+Plugins 28
OSGi & CIShell • CIShell (http://cishell.org) is an open source software specification for the integration and utilization of datasets, algorithms, and tools. • It extends the Open Services Gateway Initiative (OSGi) (http://osgi.org), a standardized, component oriented, computing environment for networked services widely used in industry since more than 10 years. • Specifically, CIShell provides “sockets” into which existing and new datasets, algorithms, and tools can be plugged using a wizard-driven process. Developers Users Workflow Alg Sci2 Tool CIShell Wizards CIShell Workflow Alg Alg Workflow NWB Tool Tool Workflow Tool 29
CIShell – Add new Plugins, e.g., Cytoscape Adding more alyout algorithms and network visualization interactivity via Cytoscape http://www.cytoscape.org. Simply add org.textrend.visualization.cytoscape_0.0.3.jar into your /plugin directory. Restart Sci2 Tool. Cytoscape now shows in the Visualization Menu. Select a network in Data Manager, run Cytoscape and the tool will start with this network loaded. 30
A number of other projects recently adopted OSGi and/or CIShell: Cytoscape (http://cytoscape.org) Led by Trey Ideker at the University of California, San Diego is an open source bioinformatics software platform for visualizing molecular interaction networks and integrating these interactions with gene expression profiles and other state data (Shannon et al., 2002). MAEviz (https://wiki.ncsa.uiuc.edu/display/MAE/Home) Managed by Jong Lee at NCSA is an open-source, extensible software platform which supports seismic risk assessment based on the Mid-America Earthquake (MAE) Center research. Taverna Workbench (http://taverna.org.uk) Developed by the myGrid team (http://mygrid.org.uk) led by Carol Goble at the University of Manchester, U.K. is a free software tool for designing and executing workflows (Hull et al., 2006). Taverna allows users to integrate many different software tools, including over 30,000 web services. TEXTrend (http://textrend.org) Led by George Kampis at Eötvös Loránd University, Budapest, Hungary supports natural language processing (NLP), classification/mining, and graph algorithms for the analysis of business and governmental text corpuses with an inherently temporal component. DynaNets (http://www.dynanets.org) Coordinated by Peter M.A. Sloot at the University of Amsterdam, The Netherlands develops algorithms to study evolving networks. SISOB(http://sisob.lcc.uma.es) An Observatory for Science in Society Based in Social Models. As the functionality of OSGi-based software frameworks improves and the number and diversity of dataset and algorithm plugins increases, the capabilities of custom tools will expand. Europe OSGi/CIShell Adoption USA Europe 32
TEXTrend adds R bridge, WEKA, Wordij, CFinder, and more. See the latest versions of TEXTrend Toolkit modules at http://textrend.org/index.php?option=com_content&view=article&id=47&Itemid=53 33
Network Workbench Toolhttp://nwb.cns.iu.edu The Network Workbench (NWB) tool supports researchers, educators, and practitioners interested in the study of biomedical, social and behavioral science, physics, and other networks. In February 2009, the tool provides more 169 plugins that support the preprocessing, analysis, modeling, and visualization of networks. More than 50 of these plugins can be applied or were specifically designed for S&T studies. It has been downloaded more than 100,000 times since December 2006. Herr II, Bruce W., Huang, Weixia (Bonnie), Penumarthy, Shashikant & Börner, Katy. (2007). Designing Highly Flexible and Usable Cyberinfrastructures for Convergence. In Bainbridge, William S. & Roco, Mihail C. (Eds.), Progress in Convergence - Technologies for Human Wellbeing (Vol. 1093, pp. 161-179), Annals of the New York Academy of Sciences, Boston, MA. 34
All papers, maps, tools, talks, press are linked from http://cns.iu.edu CNS Facebook: http://www.facebook.com/cnscenter Mapping Science Exhibit Facebook: http://www.facebook.com/mappingscience 36