Download
1 / 63
630 likes | 739 Views
Explore macroeconomic indicators, GDP growth, investment trends & survey methodology in Azerbaijan. Detailed analysis of business conditions & consumer sentiment.

E N D
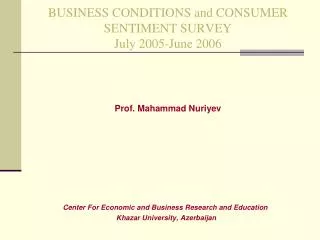
Prof. Mahammad Nuriyev BUSINESS CONDITIONS and CONSUMER SENTIMENT SURVEYJuly 2005-June 2006 Center For Economic and Business Research and Education Khazar University, Azerbaijan
Introduction • Business Conditions and Consumer Sentiment Indexes in Azerbaijan were for the first time calculated in 2006 by the Center for Economic and Business Research and Education (CEBRE), Khazar University. • The study has been carried out within the framework of the project “Strengthening Macroeconomic Forecasting Capability in Azerbaijan”. The project funded by the Sasakawa Peace Foundation. CEBRE has been carrying out the project in cooperation with the Malaysian Institute of Economic Research (MIER).
GDP and Oil Production GDP and Oil Production 14000 25 12000 20 10000 15 8000 GDP GDP (mln US $) Oil Production (mln ton) Oil Production 6000 10 4000 5 2000 0 0 2001 2002 2003 2004 2005
Oil Price (US dollars per barel) 80 75 70 60 50 50,2 40 37,9 30 29,58 28,5 25 20 10 0 2001 2002 2003 2004 2005 1Q2006 Oil Prices
Investments Directed to Azerbaijan Economy Investments directed to Azerbaijan Economy 8000 7000 6000 Total Inv. 5000 4000 Foreign Inv. mln. US $ 3000 Domestic Inv. 2000 1000 0 2001 2002 2003 2004 2005
GDP Growth 38% 40,0% 35,0% 30,0% 26,4% 25,0% 20,0% 15,0% 11,2% 10,6% 9,9% 7,0% 10,0% 5,0% 0% 2001 2002 2003 2004 2005 2006 E Azerbaijan: GDP Growth
Interest Rate 12% 9.5% 10% 10% 9% 8% 7.5% 7% 8% 6% 4% 2% 0% 01.01.01 16.09.02 23.05.05 30.06.05 01.10.05 3.07.06 Interest Rate
Layout of Questionnaire • Two-page, printed double-sided • Front page request for general information • Second page covers the survey questions • Statement of confidentially, reminder of questionnaire submission
Business Conditions Survey questionnaire - Front Page • General information requested • Name of Company • Mailing Address • Main Products (Activities) • Contact Person • Telephone Number • Email Address
Business Conditions Survey questionnaire - Second Page • Total of 17 questions • Choice of an alternative from 3 answer options • Questions kept short and simple
Current Position and Changes in the Previous half-year • Companies’ production/service volume • Capacity utilization • Sales volume • Number of employees • Labor cost per unit of product • Sale prices • Investment costs • Inventory • Cost of inputs
Expected Changes for the next half-year • Production/service volume • Sales volume • Number of employees • Labor cost per unit of product • Sale prices • Investment costs • Cost of inputs
Conducting the Survey • Consumer Sentiment Survey conducted via direct contacts with respondents • Business Condition Survey conducted via Mail and direct contacts • Each Business questionnaire enclosed with cover letter, stamped return envelope
Methodology of Calculating BCI BCI = (C1+C2+C3+C4+C5+C6+C7+C8)*2/n N-number of indicators, in our case it is 8 basic components • C1 is current production volume (in comparison with last 6 months) Q 1 • C2 is present production volume Q 2 • C3 is future production volume Q 3 • C4 is present sales volume (in comparison with last 6 months) Q 4 • C5 is present sales volume Q 5 • C6 is expected sales volume Q 6 • C7 is present investment costs (in comparison with last 6 months) Q 13 • C8 is expected investment costs Q 14
Business Activity Spheres Business Activity Spheres 45 50 38 40 31 25 (3-4)Q05 30 24 20 (1-2)Q06 20 10 6 10 0 Trade Industry Transport, Communications and others Construction
BCI and its Components BCI and its Components 140 128,3 124,6 120 100 78,2 75,0 77,6 80 68,9 72,1 70,1 70,8 69,4 69,8 (3-4) Q05 63,8 62,4 56,3 56,7 (1-2) Q06 60 53,4 37,3 40 29,7 20 0 C1 C2 C3 C4 C5 C6 C7 C8 BCI
Product Volume in Comparison withthe Previous 6 months Product volume in comparison with the previous 6 months 60.0 51.1 50.0 43.3 41.0 35.8 40.0 (3-4)Q05 30.0 (1-2)Q06 15.7 20.0 11.1 10.0 2.1 0.0 0.0 Remained unchanged Decreased No answer Increased
Current Capacity Utilization Level Capacity utilization level at present 60,0 50,7 46,8 50,0 41,6 34,3 40,0 (3-4)Q05 5,3 30,0 3,0 20,0 (1-2)Q06 11,9 6,3 10,0 0 Above Full Capacity Capacity Below Capacity No answer
Expected Production Volume for the Next 6 months Product volume for the next 6 months 60,0 53,7 47,0 46,3 50,0 36,8 40,0 (3-4)Q05 30,0 (1-2)Q06 20,0 6,7 5,8 10,0 3,7 0,0 0 Increase Remain unchanged Decrease No answer
Product Sales in Comparison with the Previous 6 months Product sales in comparison with the previous 6 months 50,0 44,0 41,6 41,6 40,0 34,3 30,0 (3-4)Q05 21,6 (1-2)Q06 20,0 14,7 10,0 2,1 0,0 0 Remained unchanged Decreased No answer Increased
Current Sales Sales at present are 70,0 57,4 60,0 52,2 50,0 40,0 (3-4)Q05 30,6 24,7 30,0 (1-2)Q06 17,2 16,8 20,0 10,0 1,1 0 0 Good Satisfactory Bad No answer
Expected Sales in the Next 6 months Sales in the next 6 months 70,0 61,6 55,2 60,0 50,0 39,6 40,0 (3-4)Q05 33,2 30,0 (1-2)Q06 20,0 5,2 10,0 4,7 0,0 0,5 0 Increase Remain unchanged Decrease No answer
Employment in Comparison with the Last 6 months Employment in comparison with the previous 6 months 60,0 53,7 53,7 50,0 36,3 40,0 32,1 (3-4)Q05 30,0 (1-2)Q06 20,0 13,4 9,5 10,0 0,7 0,5 0 Increased Decreased No answer Remained unchanged
Expected Employment Employment in the next 6 months 70,0 60,0 61,2 60,0 50,0 35,1 40,0 (3-4)Q05 34,2 30,0 (1-2)Q06 20,0 5,8 10,0 3,7 0 Increase Remain unchanged Decrease
Wage per Unit of Output in Comparison with the Last 6 months Wages per unit of output in comparison with the previous 6 months 70,0 59,0 60,0 51,1 50,0 39,5 (3-4)Q05 40,0 27,6 30,0 (1-2)Q06 20,0 13,4 6,3 10,0 0,0 3,2 0 Increased Remained unchanged Decreased No answer
Wage per Unit of Output Wage per unit of output in the next 6 months 60,0 52,6 52,2 50,0 43,3 38,9 40,0 (3-4)Q05 30,0 (1-2)Q06 20,0 0,7 5,3 10,0 3,7 3,2 0,0 Increase Remain unchanged Decrease No answer
Sales Prices Sales prices in comparison with the previous 6 months 60,0 50,0 48,5 50,0 41,6 39,6 40,0 (3-4)Q05 30,0 (1-2)Q06 20,0 11,9 7,4 10,0 1,1 0,0 0 Increased Remained unchanged Decreased No answer
Expected Sales Prices in the Next 6 months Sales prices in the next 6 months 70,0 58,9 57,5 60,0 50,0 40,0 33,2 (3-4)Q05 32,1 30,0 (1-2)Q06 20,0 10,4 5,8 10,0 2,1 0,0 0,0 Increase Remain unchanged Decrease No answer
Investment Investment spending in comparison with the previous 6 months 60,0 50,5 49,3 50,0 40,5 40,3 40,0 (3-4)Q05 30,0 (1-2)Q06 20,0 9,7 6,3 10,0 0,7 2,6 0,0 Increased Remained unchanged Decreased No answer
Investment Spending in the Next 6 months Investment spending in the next 6 months 70,0 58,9 60,0 50,0 50,0 39,6 37,4 40,0 (3-4)Q05 30,0 (1-2)Q06 20,0 9,7 10,0 2,6 1,1 0,7 0,0 Increase Remain unchanged Decrease No answer
Finished Goods Inventory Compared to desired level, finished goods inventory 63,4 70,0 56,8 60,0 50,0 (3-4)Q05 40,0 30,5 30,0 23,1 (1-2)Q06 20,0 11,9 8,9 3,7 10,0 1,5 0,0 High Suitable Low No answer
Price of Input in Comparison with the Last 6 months Price of input (Raw materials, energy and subcontracting) in comparison with the previous 6 months 80,0 68,4 70,0 60,0 50,7 50,0 41,0 (3-4)Q05 40,0 (1-2)Q06 25,3 30,0 20,0 7,5 3,7 2,6 10,0 0,7 0,0 Increased Remained unchanged Decreased No answer
Expected Price of Input in the Next 6 months Prices of inputs (raw material, energy and subcontracting) in the next 6 months 73,7 80,0 70,0 60,0 47,0 43,3 50,0 (3-4)Q05 40,0 (1-2)Q06 30,0 19,5 20,0 8,2 3,7 10,0 3,2 1,5 0 Increase Remain unchanged Decrease No answer
Business Conditions Index • In spite of significant growth of GDP driven by oil production increase, BCI decreased by 3% • Production and sales show steady growth • Labor market stable and job outlook remains modest • Prices of inputs have increased and expected to increase in the next six months • Inflation acceleration and threat of double-digit inflation • Steady growth of domestic non-oil investment and expected reduction of the FDI
Structure of Questionnaire • Qualitative in nature • Questions kept relatively straightforward and simple • Questions covered relate to current conditions and expectations for the coming months • A total of eleven attitudinal questions are asked in the survey • Questions are categorized by household income changes, current economic conditions and future expectations
Questions Asked in Survey • Households’ present financial position in comparison with the previous 6 months • Households’ current financial position • Households’ expected financial position • Current availability of jobs • Expected availability of jobs • Good/bad time to buy major consumer durables • Expectations on general price changes • Spending plans for durables
Consumer Sentiment Index questionnaire - Front Page • General information requested • Age • Education • Occupation • Gender • Family status • Family size • Address • Telephone number
Consumer Sentiment Index questionnaire - Second Page • Total of 11 questions • Questions cover the following areas: • Economic conditions and changes during the last six months • Current economic conditions • Expectations for the next six months
Calculation of the CSI The index is computed based on 3 indicators: • The indicator of current financial position of household CFP (Q1) • The indicator of expected financial position of household EFP (Q2) • The indicator of expected employment outlook EEO (Q5) Indicator = (((number of positive answers / sum of all answers)*100)*2) + (((number of neutral answers / sum of all answers)*100)*1)
Calculation of the CSI CSI = ((CFP+EFP+EEO)/n)*100/base year • t – is the six months under the review • CFP - Households’ current financial position • EFP - Households’ expected financial position • EEO - Households’ expected employment outlook
CSI and its Components CSI and its components 140 123.6 123.5 111.2 120 110 107.3 106.3 103.1 100 99.1 98.9 100 80 (3-4)05 (1-2)06 60 40 20 0 CFP EFP EEO CSI CSI (base year)
Current Financial Position in Comparison with the past 6 months Current Financial Position in comparison with the past 6 months 60 52,1 46,0 50 40 (3-4)Q05 30 23,9 22,9 22,1 20,8 (1-2)Q06 20 8,9 10 3 0,2 0,1 0 Better Same Worse Don’t know No answer
Current Financial Position Current Financial Position (%) 70 57,2 60 49,3 50 40 (3-4)Q05 30 23,6 (1-2)Q06 21,6 17,9 14,3 20 9,0 6,4 10 0,5 0,1 0 Good Satisfactory Bad Don’t know No answer
Expected Financinal Position Expected Financinal Position 40 35,6 32,7 35 28,4 27,7 27,5 30 26,5 25 (3-4)Q05 20 (1-2)Q06 15 10,9 10,3 10 5 0,3 0,1 0 Better Same Worse Don’t know No answer
Comparative Analysis of the Financial Position Comparative Analysis of the Financial Position 140 123.6 120 103.1 120.2 99.9 100 97.8 80 (3-4)Q05 90.2 60 (1-2)Q06 40 20 0 CCFP CFP EFP