Intelligence: Genetics
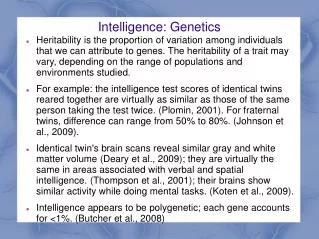
Intelligence: Genetics. Heritability is the proportion of variation among individuals that we can attribute to genes. The heritability of a trait may vary, depending on the range of populations and environments studied.

Intelligence: Genetics
E N D
Presentation Transcript
Intelligence: Genetics • Heritability is the proportion of variation among individuals that we can attribute to genes. The heritability of a trait may vary, depending on the range of populations and environments studied. • For example: the intelligence test scores of identical twins reared together are virtually as similar as those of the same person taking the test twice. (Plomin, 2001). For fraternal twins, difference can range from 50% to 80%. (Johnson et al., 2009). • Identical twin's brain scans reveal similar gray and white matter volume (Deary et al., 2009); they are virtually the same in areas associated with verbal and spatial intelligence. (Thompson et al., 2001); their brains show similar activity while doing mental tasks. (Koten et al., 2009). • Intelligence appears to be polygenetic; each gene accounts for <1%. (Butcher et al., 2008)
Intelligence: Environment • Where environments vary widely, as they do among children of less-educated parents, environmental differences are more predictive of intelligence scores. (Tucker-Drob et al., 2011). • Does the family/environment effect grow with age? Does the genetic legacy effect shrink? • Mental similarities between adopted children and their adoptive families wane with age, until the correlation approaches zero by adulthood. (McGue et al., 1993). • The heritability of 'g' factor increases from about 30% to 50% in adulthood. • Adopted children's verbal ability over time becomes more like those of their biological parents. Fig. 31.2 (Plomin & DeFries, 1998). (m407 f31.2 c391 f10.13)
Early Environment Influences • Extreme deprivation will bludgeon native intelligence, as confirmed by the Romanian orphanage studies. (Nelson et al., 2009). • Even after controlling for economic poverty, less-qualified teachers predicts lower academic acheivement scores. (Tuerk, 2005). • Relieve infant malnutrition with nutritional supplements, and poverty's effect on physical and cognitive development lessens. (Brown & Pollitt, 1996). • But...trying to create Baby Einsteins is a waste of time. Two research teams (placebo effect) assigned babies to DVD exposure or a control group. The common finding: the two groups' word-learning did not differ. (DeLoache et al., 2010). • Motivation & study skills rival aptitude (genetics) as predictors. (Crede & Kuncel, 2008).
Group Differences • In a 1932 testing of all Scottish 11-year-olds, girls' average intelligence was 100.6 and boys' 100.5 (Deary et al., 2003). • Girls are better spellers, more verbally fluent, better at locating objects, better at detecting emotions, and more sensitive to touch, taster and color. (Halpern et al., 2007). • Boys outperform girls in tests of spatial ability and complex math problems, though in math computation an d overall math performance, there is little difference. (Else-Quest et al., 2010). • In verbal and mathematical ability, boys outnumber girls at both extremes. Fig 31.3 Gender-equal cultures exhibit little gender gap. (Guiso et al., 2008). (m409 f31.3 c393 f10.14) • Boys outperform girls in mental spatial rotation of objects. (Halpern, 2000). Action video games boosts spatial abilities. (Feng et al., 2007).
Racial Differences • The general consensus among researchers is: “The bell curve for Whites centered around IQ 100; the bell curve for American Blacks roughly around 85; and those for different subgroups of Hispanics somewhere in between. (Avery et. al., 1994). The gap appears to have stopped narrowing to those born after 1970. (Murray, 2007). Finally, the hearing outscore the born deaf. (Braden, 1994). • This takes us back to heritability--Fig. 31.5. Even if the variation between members within a group reflects genetic differences, the average difference between the groups may be wholly due to the environment. (m411 f31.5 c396 f10.16) • Environmental effects can be seen in British, Norwegian & American adolescents, who are several inches taller than their mid-1800s counterparts. (Floud et al., 2011).
Racial Differences Cont'd • Scholars argue that there is no reality to race, though there are genetic markers for race. That means everyone who is lactose-intolerant is a member of the same race [not in 2012 text]. • With increasingly mixed ancestries, more people self-identify as multi-racial. (Pauker et al., 2009). • Environments can stimulate intelligence. Today's Sub-Saharan Africans have the same IQs as the British in 1948. (Wicherts et al., 2010). • Asian students outperform North American students on math acheivement and aptitude tests, this may be because they attend school 30 more days per year and spend much more time on math homework. (Larson & Verna, 1999). • The Jewish culture of excellence, they are 27% of Nobel Laureates, and 54% of world chess champions. (Brooks, 2010).
The Two Meanings of Bias • A test is considered biased if it detects not only differences in intelligence but also performance differences caused by cultural experiences. Review: U.S. Immigration Act of 1924 • Could creating culture-neutral questions--such as by assessing people's ability to learn novel words, sayings and analogies--enable culture-fair aptitude tests. (Fagan & Holland, 2009)? • On the contrary, racial group differences persist on nonverbal items, such as counting digits backwards. (Jensen, 1998). • The scientific definition of bias: a test that does not accurately predict future acheivement, such as one where men outperform women. When valid, an intelligence test score of 95 predicts slightly below-average grades, a rough prediction that applies equally to all.
Test-Takers Expectations • Spencer et al., (2002) observed a self-fulfilling stereotype threat among both women and Blacks when competing in math tests with White males. • If when taking an exam, you are worried that your type often doesn't do well, your self-doubts and self-monitoring may hijack your working memory and impair your performance. (Schmader, 2010). • This concept yields insight into why women score higher on math tests when no male test-taker is present, and why women's chess drops sharply when they think they are playing a male opponent. (Maass et al., 2008). • Minority students in university programs that challenge them to believe in their potential have likewise produced markedly higher grades and lower dropout rates. (Wilson, 2006).