Download
1 / 15
150 likes | 198 Views
Explore density using popcorn and salt in this hands-on lab to develop models for abstract concepts. Analyze data, calculate densities, graph results, and draw conclusions about the substances used.

E N D
Purpose • To develop a model of an abstract concept
Safety concerns • None • Keep area clean
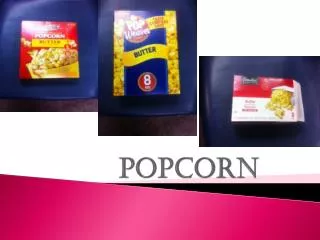
Materials • Popcorn • Kernels • Salt • Electronic balance • Cups of 3 sizes • Spatula • Graduated cylinder • Funnel
Procedure • Tare (zero) the small container on the balance • Fill the cup with salt, level with spatula and reweigh. • Record mass. • Return salt to bag. • Repeat with all containers and materials.
Calculate • For your personal data, divide the mass of each substance by the volume of the cup used. • Express your answer to the correct number of significant figures. • Show and label one calculation. The rest can be recorded in table form. • Notice any trends?
Calculate • Make the same calculation for the class average data set. • Express your answer to the correct number of significant figures. • Notice any trends?
Graph it • In a Google sheet, graph mass vs. volume for your personal data. • Include a 0,0 point (no volume = no mass) • In another sheet, graph mass vs. volume for the class average • Add a trend line (line of best fit) and display the equation for the line on the chart
Analysis • Look at the graphs you created in Google sheets. What is the slope of the line for each substance? • What does the slope represent?
Conclusion • The purpose of this lab was to provide a physical model for an abstract concept. What concept are we modeling? • If I gave you a sealed, opaque container with one of the three substances we used in this lab, could you identify what the substance was?
Conclusion • Report the density of all substances with correct units and sig figs • Discuss why the class data for the popcorn had an R-squared value closer to one than your personal data • Explain in your own words what density is. Use drawings or references to the way the different substances looked in your explanation.
Conclusion • Provide examples of how this concept is relevant in real life.