Download
1 / 39
390 likes | 495 Views
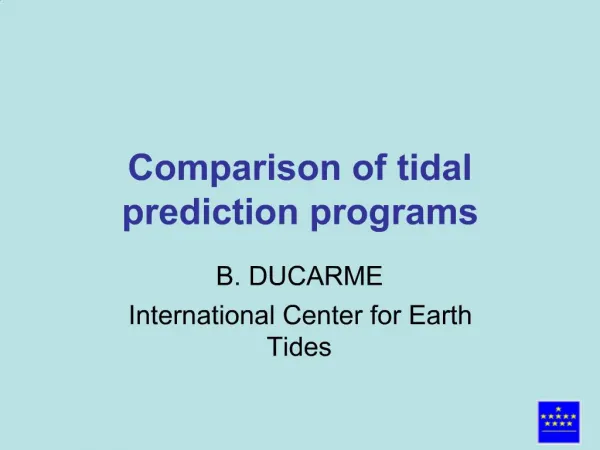
Tidal Prediction. November 3. Equilibrium Theory. Predicts periodicities, but not actual movement of tides. Dynamic Theory. Modifies equation theory to take into account: i) irregular shape and varying depth of oceans ii) Coriolis modifies water motion (rotation of the earth)

E N D
Tidal Prediction November 3
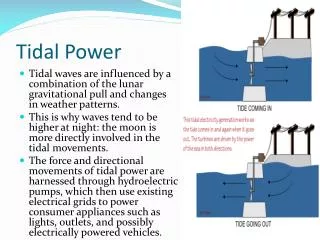
Equilibrium Theory • Predicts periodicities, but not actual movement of tides Dynamic Theory • Modifies equation theory to take into account: i) irregular shape and varying depth of oceans ii) Coriolis modifies water motion (rotation of the earth) iii) inertia of water motions • Developed by Laplace – considers wave propagation of tides rather than “bulges”
Tidal wave (not to be confused with tsunamis or storm surges) travels at shallow water gravity wave speed • Velocity of the wave is governed by the depth h
node W E l • Tidal forces set up standing waves: • Consider a rectangular basin: Tidal wave reflects from walls - Incoming waves interfere with reflected waves to produce standing wave
http://www.kettering.edu/~drussell/Demos/superposition/superposition.htmlhttp://www.kettering.edu/~drussell/Demos/superposition/superposition.html
Period of oscillation: Natural period: time for a wave to go across basin and back • Waves are not free waves – tidal forces continually act on fluid in complicated way, always varying in direction and magnitude • Forced waves must respond at forcing frequency - example: pendulum analogy
Give the pendulum a single push, the pendulum swings at a natural period determined by the length • If you keep pushing, you can make it swing at any period you wish • If you happen to push at the natural period in a way that supports natural oscillation, the amplitude of the swing increases • Known as resonance condition
In the same way, if Tn is close to the period of the tide generating force, then you get resonance and the amplitude of the standing wave increases → Basin geometry determines which tide generating forces and periodicities are most effective in generating tides
Bay of Fundy – extreme example of how bay shape augments tide
Amplification is due to combination of resonance and convergence - Narrowing bay “wedges” water together → increases height of tide • If length of bay (in the direction of tide advance) and depth are just right, can set up standing oscillation with tidal period – Resonance • Natural Period of bay very close to Semi-diurnal tidal period
At ocean basin scale, Earth’s rotation – Coriolis force – deflects tidal currents to the right in the N. hemisphere Affects standing wave pattern: - water moving to the west veers to the north, piling water up in the north side of the basin - water moving east veers to the south and piles water up there Wave moves in a counter-clockwise direction around nodal point, instead of sloshing about nodal line – Kelvin Wave
N H at t3 H at t2 H at t1 W E S • Nodal point is called Amphidromic Point - from Greek Amphi = around dromas = running • Wave moves as Kelvin Wave This is for a flat-bottom, square Ocean. The real ocean is much more complicated.
Co-Tide lines (red): High or low tide occurs at same time Co-Range lines (blue): Tidal range the same at all points Amphidromic points: Intersection of Co-Tide lines, zero tide range
In mid-ocean, tide range is small ~50 cm • In shallow water, amplitude increases, particularly in gulfs and embayments along coast • Tide classification by spring tidal range – - Microtidal – less than 2 m - Mesotidal – 2-4 m - Macrotidal - > 4 m
Remember, tide travels at: • In some very long, narrow estuaries and rivers, the velocity of water in tidal currents becomes larger than Cp - causes tidal wave to steepen and break, just like gravity waves on the beach, creating a tidal bore traveling up the river - largest bores in China (7.5 m) and on the Amazon (5 m)
Measuring Tides 180 Primary Water Level Gauges Nationally
(http://tidesandcurrents.noaa.gov/publications/tidal_datums_and_their_applications.pdf)
Tidal Prediction • If tides in the ocean were in equilibrium with the tidal potential, tidal prediction would be much easier • Tidal Prediction for Ports and Shallow Water - Two methods are used to predict future tides at a tide-gauge station using past observations of sea level measured at the gauge: (1) The Harmonic Method: - traditional method, and it is still widely used. - uses decades of tidal observations from a coastal tide gauge from which the amplitude and phase of each tidal constituent (the tidal harmonics) in the tide-gage record are calculated (2) The Response Method: - method developed by Munk and Cartwright (1966), calculates the relationship between the observed tide at some point and the tidal potential. - The relationship is the spectral admittance between the major tidal constituents and the tidal potential at each station. The admittance is assumed to be a slowly varying function of frequency so that the admittance of the major constituents can be used for determining the response at nearby frequencies. Future tides are calculated by multiplying the tidal potential by the admittance function.
Tidal Constituents Eight main tidal constituents for Tampa Bay Constituent – One of the harmonic elements in a mathematical expression for the tide-producing Force in corresponding formulas for the tide or tidal current. Each constituent represents a Periodic change or variation in the relative positions of the Earth, Moon, and Sun Amplitude – One-half the range of a constituent tide, may be applied also to the maximum speed of a constituent current Phase – phase lag, may be expressed in angular measure as 360° Period – Time between two consecutive like phases of the tide or tidal current Constituents and definitions are from www.tidesandcurrents.noaa.gov
Harmonic Constituents Name Definitions (first 37 most important) M2- Principal lunar semidiurnal constituent S2- Principal solar semidiurnal constituent N2- Larger lunar elliptic semidiurnal constituent K1- Lunar diurnal constituent M4- Shallow water overtides of principal lunar constituent O1- Lunar diurnal constituent M6- Shallow water overtides of principal lunar constituent MK3- Shallow water terdiurnal S4- Shallow water overtides of principal solar constituent MN4- Shallow water quarter diurnal constituent NU2- Larger lunar evectional constituent S6- Shallow water overtides of principal solar constituent MU2- Variational constituent 2N2- Lunar elliptical semidiurnal second-order constituent OO1- Lunar diurnal LAM2- Smaller lunar evectional constituent S1- Solar diurnal constituent M1- Smaller lunar elliptic diurnal constituent J1- Smaller lunar elliptic diurnal constituent MM- Lunar monthly constituent
Harmonic Constituents Name Definitions – Continued SSA- Solar semiannual constituent SA- Solar annual constituent MSF- Lunisolar synodic fortnightly constituent MF- Lunisolar fortnightly constituent RHO- Larger lunar evectional diurnal constituent Q1- Larger lunar elliptic diurnal constituent T2- Larger solar elliptic constituent R2- Smaller solar elliptic constituent 2Q1- Larger elliptic diurnalP1- Solar diurnal constituent 2SM2- Shallow water semidiurnal constituent M3- Lunar terdiurnal constituent L2- Smaller lunar elliptic semidiurnal constituent 2MK3- Shallow water terdiurnal constituent K2- Lunisolar semidiurnal constituent M8- Shallow water eighth diurnal constituent MS4- Shallow water quarter diurnal constituent
Plot showing predicted water level, observed water level, and observed – predicted at the St. Petersburg station from September 26, 2006 – October 24, 2006 Plot is from www.tidesandcurrents.noaa.gov
Tidal Prediction for Deep-Water - Prediction of deep-ocean tides is much more difficult than prediction of shallow-water tides because tide gauges were seldom deployed in deep water. - All this changed with the launch of Topex/Poseidon. The satellite was placed into an orbit especially designed for observing ocean tides (Parke et al., 1987) , and the altimetric system was sufficiently accurate to measure many constituents of the tide. - Data from the satellite have now been used to determine deep-ocean tides with an accuracy of ± 2cm. For most practical purposes, the tides are now known accurately for most of the ocean - Prediction Using Hydrodynamic Theory: Purely theoretical calculations of tides are not very accurate, especially because the dissipation of tidal energy is not well known.
Tidal Datums – Reference levels for water level measurements Computed from Water Level Observations over a 19-year Tidal Epoch MHHW – Mean Higher High Water – Average of all Higher High Water observations MHW – Mean High Water – Average of all HW observations MSL - Mean Sea Level – Average of all hourly Water Level observations MTL – Mean Tide Level – Average of all HW and LW observations or ½(MHW+MLW) MLW – Mean Low Water – Average of all LW observations MLLW – Mean Lower Low Water – Average of all Lower Low Water observations – Reference level for tide gauges and depth measurements – “Chart Datum” Geodetic Datums – fixed reference system used by surveyors, topo maps, etc. NGVD29 – National Geodetic Vertical Datum of 1929 - Also known as the Sea-level Datum of 1929 NAVD88 - North American Vertical Datum of 1988
(http://tidesandcurrents.noaa.gov/publications/tidal_datums_and_their_applications.pdf) Datums are transferred from location to location by leveling – Geodetic datums carried across continent in this way – NAVD88 from Rimuski, Canada
(http://tidesandcurrents.noaa.gov/publications/tidal_datums_and_their_applications.pdf)
(http://tidesandcurrents.noaa.gov/publications/tidal_datums_and_their_applications.pdf)
Relationship between Tidal and Geodetic Datums varies with location and with Time
(http://tidesandcurrents.noaa.gov/publications/tidal_datums_and_their_applications.pdf)
Tidal Datums determine position of Shoreline – determine private ownership, EEZ, etc.
Storm Surge • Occur when storm winds blowing over shallow, continental shelves pile water against the coast, increasing sea level. • Several processes are important in storm surge: • Ekman transport by winds parallel to the coast transports water toward the coast causing a rise in sea level. • Winds blowing toward the coast push water directly toward the coast. • Wave run-up and other wave interactions transport water toward the coast adding to the first two processes. • Edge waves generated by the wind travel along the coast. • The low pressure inside the storm raises sea level by one centimeter for each millibar decrease in pressure through the inverted-barometer effect. • Finally, the storm surge adds to the tides, and high tides can change a relative weak surge into a much more dangerous one.
Katrina Storm Surge Waveland, MS Biloxi, MS
Figure 17.9 in Stewart. Probability (per year) density distribution of vertical height of storm surges in the Netherlands. The distribution function is Rayleigh, and the probability of large surges can be estimated from extrapolating the observed probability of smaller, more common surges. From Wiegel (1964: 113).