Tidal Observation
Tidal Observation. Chang Hsien Kuo. 國立交通大學土木工程學系 中華民國 102 年 3 月 6 日. Float type or analogue tide gauges. Float type or analogue tide gauges. http://refmar.shom.fr/documentation/instrumentation/maregraphe-a-flotteur.

Tidal Observation
E N D
Presentation Transcript
Tidal Observation Chang HsienKuo 國立交通大學土木工程學系 中華民國102年3月6日
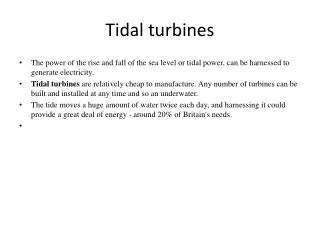
Float type or analogue tide gauges http://refmar.shom.fr/documentation/instrumentation/maregraphe-a-flotteur The invention of the first self-recording float gauge is usually attributed to an English engineer named Henry Palmer in 1831, but this prototype was never used to collect continuous measurements over long periods. In France, the hydrographerChazallon, author of the tide tables of the coasts of France in 1839, developed one of the first operational float gauges in 1842. In 1859 there were some ten operating on the French coast. Starting in the 1990s, float gauges were gradually replaced by digital gauges (first ultrasonic then radar).
pressure tide gauges • H: depth of the measurement location (average immersion of the sensor) • h (t): the change in sea level, a function of time t and the zero mean h(t) = 0 • p (t): the pressure measured by the sensor • Pa (t): the atmospheric pressure at sea level, • ρ : the average density of the sea water • G: the acceleration of gravity
Ultrasonic tide gauges In the 1980s, to upgrade the existing network of tide gauges in the US, the Naval Oceanographic Survey (NOS) undertook a study showing that the airborne acoustics method for measuring distances was likely to achieve the best compromise between the quality of sea level measurements and the overall cost of the network. This cost included acquisition, operation and maintenance for a period of 20 years. The operation of ultrasonic gauges (ultrasonic transducers) is simple: the air draft between the tide gauge and the sea surface is measured by the transmission and reception of ultrasonic waves emitted into the air at 41.5 kHz. H = d – l = d – (c Δt / 2) c = 331.2 [ 1 + 0.97(w/pa) + 1.9 10-3T] m/s
Radar tide gauge Measuring water depth by radar wave has become widespread since the late 1980s and is now a common technique with a large number of sensors available on the market. For coastal tide stations, the advantage of these ultrafrequency radars is that they have a constant speed (the speed of light) offering height measurements over short distances that are unaffected by environmental conditions. These gauges meet all the accuracy requirements, but they can be tricky to install and calibrate. A structure above water is necessary for the transducer to be referenced vertically
Radar tide gauge Poffa N., S. Enet, J.-C. Kerinec, équipeprojet RONIM (2012). Evolution instrumentale des marégraphes du réseau RONIM. JNGCGC, Cherbourg, pp. 611-618. Martın Mıguez B.,R. Le Roy, G. Woppelmann (2008). The Use of Radar Tide Gauges to Measure Variations in Sea Level along the French Coast. Journal of Coastal Research, vol 24, 4C, pp.61-68 Simon B. (2007). La Marée - La maréeocéanique et côtière. Edition Institutocéanographique, 434pp.
Data Acquisition One-hour tide gauge data Every sharp hour, the unit acquires a series of measurements over a period of six minutes. The series is averaged 6-minute tide gauge dataEvery 6 minutes, the unit acquires a series of measurements over a period of two minutes. The series is averaged to produce digitally-filtered water height data. These, as well as the hourly atmospheric pressure measurement are filed on the unit's memory board (capacity approximately 1 year's data).1-second tide gauge dataThe measurements taken every second are not archived by the data logger.