Download
1 / 15

E N D
Change in supply If non-price determinants of supply should change the supply curve will shift and we say there has been a change in supply. Note a decrease in supply is a leftward movement of the supply curve. The amount supplied is measured horizontally, i.e., rightward and leftward. P S2 S1 S2 represents a lower supply. Q
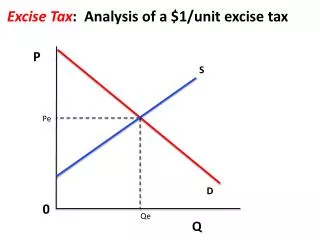
excise tax An excise tax is a tax on the seller of a product. We treat the tax as a cost of doing business. If there is no tax the seller will offer Q1 for sale when the price is P1. In other words the seller is indicating they need P1 to supply Q1. P S1 P1 Q Q1
excise tax If a lump sum excise tax is imposed then the seller still needs to get P1 for their own efforts in order to supply Q1. This means the price in the market will have to be P1 plus the tax to supply Q1. Thus the supply curve shifts up by the amount of the tax. P S1 S2 P2 = P1 + tax P1 Q Q1
The excise tax is paid by the producer. So prices on the supply curve WILL include the excise tax because after the suppliers get the money they have to send some on to the government and the suppliers still need to get the amount they want for the item sold. Remember that the actual price in the market is determined by both supply and demand. So, just because the supply shifts up by the tax does not mean the market price will rise by the tax.
effect of excise tax on the market S1 = supply curve before tax D1 = demand curve S2 = supply curve after tax P1, Q1 = initial equil. P3, Q2 = new equil. Note 1) Q2 < Q1 - lower output 2) P3 > P1 - higher market price 3) tax = P3 - P1 + P1 - P3 + tax = P3 – P1 + P1 – (P3 – tax) P S2 S1 P3 P1 P3 - tax D1 Q Q2 Q1 decrease in amount seller keeps after the tax, per unit increase in amount paid by consumer on per unit basis
In our supply and demand graph we have seen that when a per unit tax is imposed on the seller the supply shifts up by the amount of the tax. This vertical line here is the amount of the tax. I have shown my right hand as well because I am going to push the line with my hand into a supply and demand graph on the next few slides and WEDGE the tax into the S & D curves. Here goes.
P S D Q
P S D Q
P S D Q
So, you can see by the graph, when we wedge the tax into the graph we can see the supply shifts up by this amount. P S D Q
P2 – P1 = amount of tax paid by consumer P1- (P2 – tax) = amount of tax paid by producer b + c + d = loss in consumer surplus due to tax e + f + g = loss in producer surplus due to tax b + c + e + f = tax revenue and d + g = efficiency loss of tax. P S a b c d e f g h P2 P1 P2 - Tax D Q Q2 Q1
Sometimes in an economic problem we get data in the form of a table like Monthly rent Apartments Apartments (price) demanded supplied $2500 10,000 15,000 2000 12,500 12,500 1500 15,000 10,000 1000 17,500 7,500 500 20,000 5,000 Here the only price that has quantity demanded and quantity supplied equal is the price $2000 and the amounted supplied and demanded is 12,500. This is equilibrium!
If there is an excise tax the only way the amounts shown on the supply side will be supplied is if the price on the supply goes up by the tax. I have added a supply side “price” here when the tax is assumed to be $1000. Monthly rent Apartments Apartments Supply (price) demanded supplied price $2500 10,000 15,000 $3500 2000 12,500 12,500 3000 1500 15,000 10,000 2500 1000 17,500 7,500 2000 500 20,000 5,000 1500 Now the monthly rent column only refers to the demand price and that has to be matched with the supply price. Note when the demand price is $2500 the Qd = 10,000 and when the supply price is $2500 the Qs = 10,000. The new equilibrium is P = 2500 and Q = 10,000.
Note the original price was 2000 and the quantity in the market was 12,500. Now we have a market price of 2500 and a quantity traded 10,000. Since 10,000 units are traded and the tax is 1000 per unit the government tax revenue is 1000(10,000) = $10 million! The loss in consumer surplus is the change in price times the new quantity plus ½ of the change in price times the change in quantity traded = (2500 – 2000)10,000 + .5(2500 – 2000)(12,500 – 10,000) = 500(10,000) + .5(500)(2,500) = $5,000,000 + $625,000 = $5,625,000. The loss in producer surplus is the change in what the seller gets to keep times the new quantity + ½ of the change in what the seller gets to keep times the change in the quantity traded = (2000 – 1500)10,000 + .5(2000 – 1500)(12,500 – 10,000) = $5,000,000 + $625,000 = $5,625,000. The deadweight loss of the tax =………………………….?