
Uploaded by
penha
1 SLIDES
109 VIEWS
10LIKES
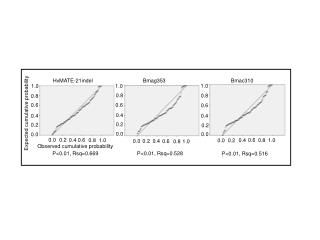
Comparative Analysis of Expected and Observed Cumulative Probability in Statistical Data Analysis
DESCRIPTION
This study compares the expected and observed cumulative probability in statistical data analysis, revealing significant findings and insights with a detailed analysis of probability values and Rsq scores.
Download
1 / 1
Download Presentation 
Comparative Analysis of Expected and Observed Cumulative Probability in Statistical Data Analysis
An Image/Link below is provided (as is) to download presentation
Download Policy: Content on the Website is provided to you AS IS for your information and personal use and may not be sold / licensed / shared on other websites without getting consent from its author.
Content is provided to you AS IS for your information and personal use only.
Download presentation by click this link.
While downloading, if for some reason you are not able to download a presentation, the publisher may have deleted the file from their server.
During download, if you can't get a presentation, the file might be deleted by the publisher.
E N D
Presentation Transcript
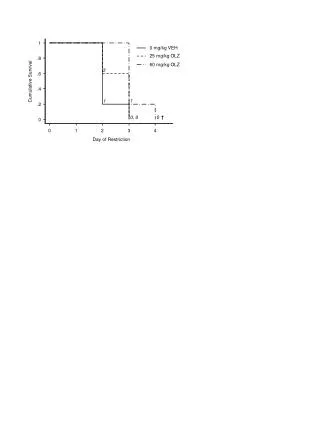
HvMATE-21indel Bmag353 Bmac310 1.0 1.0 1.0 0.8 0.8 0.8 0.6 0.6 0.6 Expected cumulative probability 0.4 0.4 0.4 0.2 0.2 0.2 0.0 0.0 0.0 0.0 0.2 0.4 0.6 0.6 1.0 0.4 1.0 0.8 0.8 0.2 0.0 0.0 0.2 0.4 0.6 1.0 0.8 Observed cumulative probability P<0.01, Rsq=0.528 P<0.01, Rsq=0.669 P<0.01, Rsq=0.516
![Cumulative distribution [%]](https://cdn1.slideserve.com/2142714/slide1-dt.jpg)


More Related