Download
1 / 69
710 likes | 876 Views
New Anthrax CounterMeasure. The University of Oklahoma – Chemical Engineering. Vi Pham, Zachary Taylor and Miguel Bagajewicz April 28, 2008. Outline of Presentation. Anthrax Background Our Key Agent Technical Feasibility Scale-Up Design FDA Approval Process Marketing Strategy

E N D
New Anthrax CounterMeasure The University of Oklahoma – Chemical Engineering Vi Pham, Zachary Taylor and Miguel Bagajewicz April 28, 2008
Outline of Presentation • Anthrax Background • Our Key Agent • Technical Feasibility • Scale-Up Design • FDA Approval Process • Marketing Strategy • Pricing Models • Profitability Calculations
Need for Anthrax Countermeasures Most serious bioterrorism threat today!!
Need for an Anthrax Countermeasure Bioterrorism in the U.S., October 2001 • Envelopes containing anthrax spores • 22 anthrax cases
Need for an Anthrax Countermeasure Impact of an Anthrax Bioterrorist Attack • 100 kg of aerosolized anthrax over Washington D.C. • 130,000 – 3,000,000 deaths • $26.2 billion per 100,000 persons exposed Current FDA-Approved Medical Countermeasures: • Anthrax Vaccine Absorbed (AVA) • Post-exposure antibiotics
Our Objective Develop an inhalational anthrax countermeasure that can overcome the limitations of existing anthrax countermeasures.
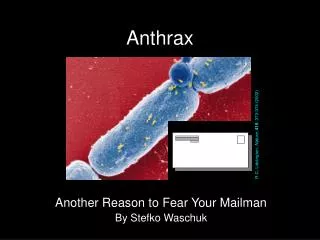
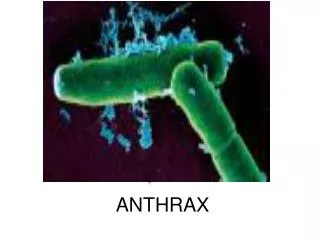
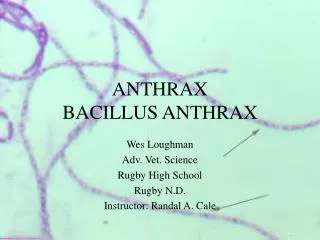
Anthrax Background An infectious disease caused by the spore-forming bacterium Bacillus anthracis. Virulent factors: • poly-γ-glutamate capsule • anthrax toxins http://www.sciam.com/article.cfm?id=special-delivery
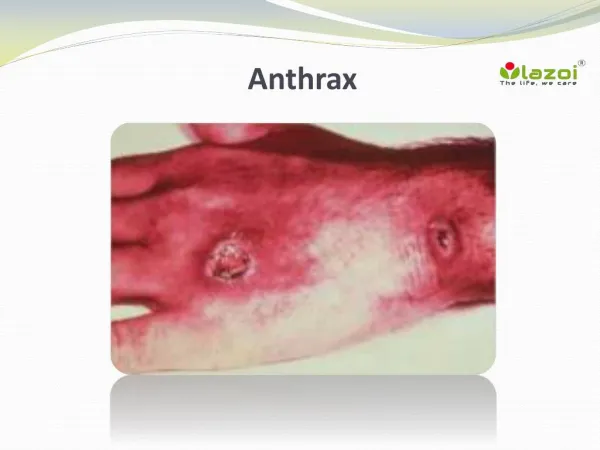
Methods of Infection Cutaneous Gastrointestinal Inhalational Direct contact with the bacteria or spores through cuts Mortality rate: 20% Consumption of raw or undercooked contaminated meat Mortality rate: 25-60% Inspiration of 5000-8000 anthrax spores Mortality rate: 75% *Mortality rate is based on a lack of administration of antibiotics. Images modified from: http://www.usatoday.com/graphics/news/gra/ganthraxqa/flash.htm
Infection Route of Inhalational Anthrax Anthrax spores Macrophage cell Anthrax bacteria Healthy macrophage cells Anthrax spore Lymph node
Infection Route of Inhalational Anthrax 2 1 5 3 5 No Infection! 5 4 Anthrax bacteria eliminated and patient survives!
Key Agent – Previous Research Macrophages Neutrophils A. Without parts of our Key Agent B. With parts of our Key Agent The key agent drastically improves the body’s ability to eliminate anthrax
Possible Pre-Clinical Experiments • Pilot-scale key agent production and modification • Evaluate kinetics of key agent effects and anthrax killing • Perform in vitro toxicity study • Test efficacy in vitro • Computer simulation of in vivo effects • Perform in vivo toxicity study • Test efficacy / pharmacokinetics in vivo
Dosage per Treatment • Concentration based on pharmacokinetics and bioavailability of drug (large uncertainty) • Concentration also based on number of doses in 60 day treatment period • As half-life and number of doses increase, needed concentration decreases • Effectiveness measured by fraction of spores germinating and surviving at day 60 http://english.people.com.cn/200608/05/images/antibiotics1.jpg
Scale-up Assumptions • 8000 working hours per year (~91%) • 1 mmol solutions to find reactor volumes • Stainless steel, stirred reactors • Stainless steel, agitated tanks • Straight line depreciation • 2% inflation • Maintenance 15% of equipment cost / year • Auxiliary equipment 10% of major equipment cost • 1 skilled worker for each reactor and column • 1 non-skilled worker for auxiliary equipment, tanks (stock) and maintenance
Stage One Decisions • 3 doses per treatment regimen (always more profitable than 1 and 2 dose regimens) • Send only one agent to FDA trials (minimizes time spent in pre-clinical experiments and cost of FDA) • Apply for FDA fast-track (minimize time in FDA) • Do not perform in vitro toxicity study (minimize time spent in pre-clinical experiments)
Process Flow Diagram – Case 1 6 Batch Reactors, 2 Chromatography Columns
Process Flow Diagram – Case 2a 5 Batch Reactors, 2 Chromatography Columns
Process Flow Diagram – Case 2b 8 Batch Reactors, 2 Chromatography Columns (purification sequence not shown)
Process Flow Diagram – Case 3 12 Batch Reactors, 2 Chromatography Columns (purification sequence not shown)
Process Flow Diagram – Case 4 12 Batch Reactors, 2 Chromatography Columns (purification sequence not shown)
Biological Countermeasure Drugs Animal Efficacy Rule: • Demonstrate efficacy within an appropriate animal model • Demonstrate safety within human subjects Fast Track ($1 million): • Priority Review (6 months) Emergency Use Authorization (EUA): • Large-scale production of drug before FDA approval for the National Strategic Stockpiling
Experimental Protocols:Estimation of Time, Labor, and Cost Time • Based on projections and previous experiments. Labor & Cost • Cost of each experimental protocol: Labor + Other Expenses • Other Expenses = 0.5*Labor • Salaries with benefits range from $70,000 - $132,000
Experimental Protocols:Pre-Clinical Research • Triplicate Data • Animal Model: Rhesus monkeys • Efficacy/Toxicity Control: Ciprofloxacin Total Preclinical Cost: $5.2 million Total Preclinical Time: 4.5 years
Experimental Protocols:FDA Approval Process • Lobbying: $1.8 million • Fast Track: Priority Review • Phase 1: Pharmacokinetics (side effects, dose ranging, kinetics) • Phase 2: Pharmacokinetics (gender differences, food interaction) Total Cost: $12.0 million Total Time: 7 years
Other Anthrax Drug Investments Borio et al., Anthrax Countermeasures: Current Status and Future Needs. Biosecurity and Bioterrorism: Biodefense Strategy, Practice, and Science. Vol. 3 (2). 2005.
Marketing Strategy • Project BioShield • $5.6 billion for improved vaccines and drugs against CBRN agents • Department of Health & Human Services • RFP seeking 10,000-200,000 treatments for inhalational anthrax disease • Intended Market • Stockpile • Military • Major Incentives • Key agent is newer and more effective • Cheap to produce
Marketing Strategy: Project BioShield Contract Project BioShield Contract • Must be “licensable” • Must be able to mass produce • Delivery within 8 years Lobbying • $1.8 Million • Basis: AVA vs. VaxGen rivalry
Current Countermeasures: Vaccines • BioThrax (Anthrax Vaccine Absorbed) • Requires 6 doses over 18 months • Annual booster shots required to maintain immunity • $24.50 per dose, $147 for 6 doses • Shelf life : 3 years • Projected duration of efficacy: 1-2 years www.bioport.com
Current Countermeasures: Post-Exposure Antibiotics • Antibiotics (Ciprofloxacin, doxycycline and penicillin) • Must use within 24 hrs after exposure to anthrax • Duration of treatment: 2 times daily for 60 days • Cost: $12 – $3600 for 60 days • Antibiotic resistance Fowler R. et al. Cost-Effectiveness of Defending against Bioterrorism: A Comparison of Vaccination and Antibiotic Prophylaxis against Anthrax. Ann Intern Med. 2005;142:601-610 *Prices are based on government cost
Government Pricing Value-Based Pricing • Drug comparison to assess whether the improved benefits are worth the additional cost. • Cost-benefit analysis
Government Pricing:Cost-Benefit Pricing Methods Method 1 Method 2 H1 = our benefits H2 = competitor’s benefits P* = price to make us equal to our competitor in terms of benefits and cost P2 = competitor’s drug price g = constant For both methods: If , then
Government Pricing:Cost-Benefit Analysis Determining Benefits: • Consumer Preference Function • H = benefits • j = property • w = weight of property • y = property score
Government Pricing:Cost-Benefit Analysis Properties the government values • Effectiveness (% survival) • wE= .80 • Safety (level of side effects) • wS= .15 • Resistance (level of resistance) • wR= .05
Government Pricing:Cost-Benefit Analysis Determining Effectiveness Property Score:
Government Pricing:Cost-Benefit Pricing Methods Evaluation Gamma~ 0.507
Government Pricing:Cost-Benefit Pricing Methods Evaluation P* = ? Model 1: $133 Model 2: $130 Both models yield relatively similar results!
Government Pricing:Cost-Benefit Pricing Methods Evaluation P* = ? Model 1: $127 Model 2: $130 Both models yield relatively similar results!
Government Pricing:Cost-Benefit Pricing Methods Evaluation Models valid (+/- $10) for: 0.75 < H2/H1 < 2.05