Graphing Linear Equations Using Tables: Essential Class Notes and Guidelines
This document provides comprehensive class notes on graphing linear equations using tables, focusing on key definitions and procedures. It covers understanding the coordinate plane, identifying ordered pairs, and the significance of linear equations. Detailed steps guide students through solving for y, selecting x-values, and plotting points for accurate graph representation. Additionally, it includes examples and practice exercises for students to solidify their understanding of graphing equations like 3x - 2y = 6. Perfect for reinforcing learning or reviewing essential concepts.

Graphing Linear Equations Using Tables: Essential Class Notes and Guidelines
E N D
Presentation Transcript
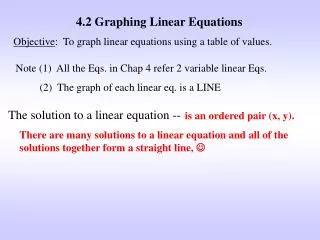
Section 4.2Graphing Linear EquationsUsing Tables Wednesday 11/13/13 Class Notes
Type 1 Let m=2, 6m+2=14 true? Let x=2, y=3 4x+y=11 true? What does this ordered pair (2,3) represent?
Important Definitions Coordinate plane: ________________________________________ _____________________________________________________ Each point on the plane corresponds to an ____________ _________ of numbers, __________ The x-axis and y-axis divide the coordinate plane into four quadrants:
RECALL: How to graph ordered pairs (x,y) “Walk before you run!!”
What does a line represent? What is this line made up of?
Use the graph to determine if the following points are solutions: (1,5) (-3,3)
How to justify your answer WITHOUT a graph: _________________________________________ _________________________________________ a) (1,5) b) (-3,3)
3 steps for Using a Table to Graph an Equation Step 1: Solve for y & write as f(x)=mx+b Step 2: Choose values for x, and use your function to fill out the table Step 3: Plot the coordinate pairs (points). A line going through these points is a graph of all possible solutions for this equations
Example: Use a table of values to graph the equation y+2=3x Step 1: Step 2:
(example cont.) Step 3: Coordinate pairs found from the table in step 2
YOUR TURN TO TRY!! Use a table of values to graph the equation 3x-2y=6 Step 1: Step 2:
(example cont.) Step 3: Coordinate pairs found from the table in step 2