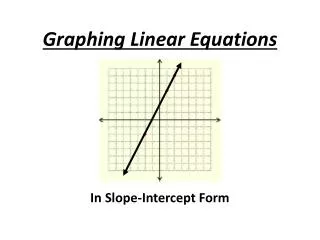
Graphing Linear Equations
Graphing Linear Equations . click on the topic to go to that section. Table of Contents. Vocabulary Review. Tables. Slope & y-intercept. Defining Slope on the Coordinate Plane. Tables and Slope. Slope Formula. Slope Intercept Form. Rate of Change. Proportional Relationships and Graphing.


Graphing Linear Equations
E N D
Presentation Transcript
click on the topic to go to that section Table of Contents • Vocabulary Review • Tables • Slope & y-intercept • Defining Slope on the Coordinate Plane • Tables and Slope • Slope Formula • Slope Intercept Form • Rate of Change • Proportional Relationships and Graphing • Slope and Similar Triangles • Parallel and Perpendicular Lines • Solve Systems by Graphing • Solve Systems by Substitution • Solve Systems by Elimination • Choose Your Strategy • Writing Systems to Model Situations
Day 1 Points & Coordinates
Vocabulary Review Coordinate Plane: the two dimensional plane or flat surface that is created when the x-axis intersects with the y-axis. Also known as a coordinate graph and the Cartesian plane. Quadrant: any of the four regions created when the x-axis intersects the y-axis. They are usually numbered with Roman numerals. I II x-axis: horizontal number line that extends indefinitely in both directions from zero. (Right- positive Left- negative) IV III y-axis: vertical number line that extends indefinitely in both directions from zero. (Up- positive Down- negative) Origin:the point where zero on the x-axis intersects zero on the y-axis. The coordinates of the origin are (0,0).
To graph an ordered pair, such as (4, 8), you start at the origin (0, 0)and then go left or right on the x-axis depending on the first number and then up or down from there parallel to the y-axis.
So to graph (4,8), we would go 4 to the right and up 8 from there.
Linear Equation: Any equation whose graph is a line. One way to check this is to create a table of values.
Tables Return to Table of Contents
Geometry Theorem: Through any two points in a plane there can be drawn only one line.
Given y = 3x + 2, we want to graph our equation to show all of the ordered pairs that make it true. So according to this theorem from Geometry, we need to find 2 points.
One way is to create a table of values. Let's consider the equation y= 3x + 2. We need to find pairs of x and y numbers that make equation true.
Let's find some values for y = 3x + 2. Pick values for x and plug them into the equation, then solve for y. x 3(x)+2 y(x,y) -3 3(-3)+2 -7 (-3,-7) 0 3(0)+2 2 (0,2) 2 3(2)+2 8 (2,8)
Now let's graph those points we just found. x 3(x) + 2 y(x,y) -3 3(-3) + 2 -7 (-3,-7) 0 3(0) + 2 2 (0,2) Notice anything about the points we just graphed? 2 3(2) + 2 8 (2,8)
That's right! The points we graphed form a line. The theorem says we only needed 2 points, so why did we graph 3 points? The third point serves as a check.
Graph y = 2x+4 click for table x 2x+4 y(x,y) x 2x+4 y(x,y) 0 2(0)+4 4 (0,4) 3 2(3)+4 10 (3,10) -1 2(-1)+4 2 (-1,2) Now graph your points and draw the line.
Graph y = -2x+1 click for table x -2(x)+1 y(x,y) 0 -2(0)+1 1 (0,1) 3 -2(3)+1 -5 (3,-5) -1 -2(-1)+1 3 (-1,3) x -2(x)+1 y(x,y) Now graph your points and draw the line.
Graph y = ¾x 3 x ¾(x)-3 y(x,y) x ¾(x)-3 y(x,y) 0 ¾(0)-3 -3 (0,-3) 4 ¾(4)-3 0 (4,0) -4 ¾(-4)-3 -6 (-4,-6) Now graph your points and draw the line.
Recall that in the previous example that even though the number in front of x was a fraction, our answers were integers. x¾(x)-3 y(x,y) 0 ¾(0)-3 -3 (0,-3) 4 ¾(4)-3 0 (4,0) -4¾(-4)-3 -6 (-4,-6) Notice the x-values chosen are zero, the denominator and the opposite of the denominator. Why? Move me to find out!
1 Given an equation of y = 2x - 5, what is y when x = 0?
2 Given an equation of y = 2x - 5, what is y if x is 1/2? A -5 B -4 C -3 D 2 E 4
3 Which point is on the line 4y − 2x = 0? A (−2,−1) B (−2,1) C (−1,−2) D (1,2) From the New York State Education Department. Office of Assessment Policy, Development and Administration. Internet. Available from www.nysedregents.org/IntegratedAlgebra; accessed 17, June, 2011.
4 Which point lies on the line whose equation is 2x − 3y = 9? A (−1,−3) B (−1,3) C (0,3) D (0,−3) From the New York State Education Department. Office of Assessment Policy, Development and Administration. Internet. Available from www.nysedregents.org/IntegratedAlgebra; accessed 17, June, 2011.
5 Given the equation y= x + 4, what would be the y-value for the corresponding x-value of -5 ? 4 A 3 B C 5 D 9
6 Given the equation y= -4x - 8, what would be the y-value for the corresponding x-value of 2? 0 A B -4 C -16 16 D
7 The graph of the equation 2x + 6y = 4 passes through point (x,−2). What is the value of x? A -4 B 8 C 16 D 4 From the New York State Education Department. Office of Assessment Policy, Development and Administration. Internet. Available from www.nysedregents.org/IntegratedAlgebra; accessed 17, June, 2011.
8 Point (k,-3) lies on the line whose equation is x - 2y = -2. What is the value of k? A -8 B -6 C 6 D 8 From the New York State Education Department. Office of Assessment Policy, Development and Administration. Internet. Available from www.nysedregents.org/IntegratedAlgebra; accessed 17, June, 2011
9 Which equation is graphed? A y = 4x-2 B y = -1/2x-4 C y = -1/2x+4 D y = -2x+4 E y = -2x+8
10 Which equation is graphed? A y = 4x + 1 B y = -1/4x + 1 C y = 1/4x + 1 D y = -4x + 1 E y = 4x - 1