Download

1 / 14
140 likes | 231 Views
Learn the importance of financial ratios in agribusiness decision-making. Discover how ratios help evaluate performance, manage finances, and make informed decisions. Examples of key ratios like current ratio, debt-to-equity ratio, and profit to gross income ratio are explained.

E N D
Analyzing Financial Statements - Ratios Agribusiness
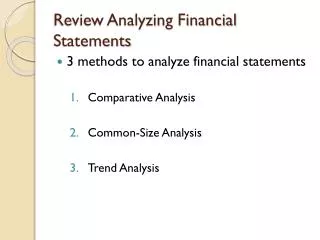
Definition of a Ratio: • A financial ratio is simply a comparison of two measurements of a business. These two measurements are expressed in terms of a ratio or one as a percentage of another. Each ratio is designed to highlight some particular phase of the financial condition of your business.
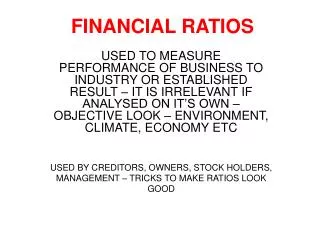
Why Ratios? • Ratios are everywhere in our lives, weather it is a batting average, fuel mileage in our vehicle, or our own net worth statement. • Ratios drive us to perform better, strive to be the best, and outperform the competition. • The same holds true in agriculture, ratios allow us to evaluate the performance of our enterprises and make educated decisions about our enterprises. • Finally ratios allow us to make educated decisions with the assistance of our financial advisor or loan officer concerning financing.
Why Ratios Continued. • The primary function of ratios is allow agriculturalists to keep track of finances without devoting a large amount of time to study of individual records. • The maximum value of ratios occurs when a producer compares specific ratios over a period of years. This is the most effective way to measure the growth of your operation.
Ratios and outperforming the competition! • Average or Benchmark ratios are established in many financial scenarios. • The benchmarks may be national, state, county, local, or personal. • Also, ratios can be compared between one agriculture business and another.
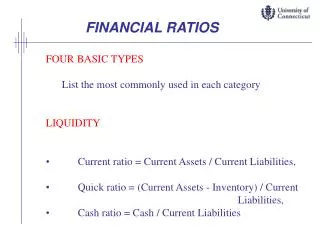
Agriculture Ratios • The following are examples of specific agriculture ratios, and their descriptions. • Current Ratio One of the most used of all ratios. It measures Liquidity which is the ability to repay debt. (also used on the State and American FFA Degree on page10)
Agriculture Ratios Example of a Current Ratio: Total Current Assets Current Ratio = ------------------------------ Total Current Liabilities $59,127 $2.15 to $1 = -------------- $27,524 • In other words this operation has $2.15 of current assets to cover each $1 of current debt. • On a side note, most lenders consider a current ratio of 2:1 good. On the other hand a ratio of less than 1:1 could mean that a business is in serious financial trouble.
Agriculture Ratios • Debt-to-Equity Ratio Otherwise known as leverage, it relates total debt to net worth. It reflects the soundness of your business. (Also used on the Sate and American Degree on page 10)
Agriculture Ratios Example of a Debt-to-Equity Ratio: Total Liabilities Debt-to-Equity = ----------------------- Net Worth $50,000 $2 to $1 = ----------------- $25,000 In this scenario the ratio is 2:1, this means that creditors have $2 invested for every $1 the producer has put into the business. The higher the ratio, the larger the share creditors have in your operation’s assets. This could mean a greater risk of exposure to both the creditors and yourself.
Agriculture Ratios • Profit to Gross Income Ratio This ratio relates the volume of your operation to the Profit (net income) otherwise known as “take home” income.
Agriculture Ratios • Example of Profit to gross income ratio: Profit (net income) Profit to Gross Income = ------------------------- Gross Income $75,000 $.50 to $1 = ---------------------- $150,000 This example shows that it took $1 of gross income (the measure for volume of a business) to produce $.50 in profit (otherwise know as take-home income).
How do we use ratios to improve an agriculture operation over time? • The following is an example of how an agriculture business’s Debt to equity Ratio improved over time. • 2004 2005 2006 2007 2:1 2:1.1 2:1.4 2:1.7 2:1.9 As you can see in the above example, this producers leverage improved over the five year span. This improvement shows that the business is getting healthier. A healthier business means more profit in the long run.
Other Agriculture Ratios • Bushels per acre • Ears of Corn per plant • Blossoms per flower • Lambs per ewe
Value of Ratios • Assess or measure individually and relation to others • Compare measures with known benchmark • Calculate measures using good information • Use measures to evaluate past, present, and future