Download
1 / 34
350 likes | 676 Views
Analyzing Financial Data and Ratios. Mr. Michael Wong Lecturer, PolyU HKCC. Value of Financial Statement Analysis. Financial statements, by their nature, are backward-looking So why analyze the statements? Analysis provides knowledge of a firm ’ s operating and financial structure

E N D
Analyzing Financial Data and Ratios Mr. Michael Wong Lecturer, PolyU HKCC
Value of Financial Statement Analysis • Financial statements, by their nature, are backward-looking • So why analyze the statements? • Analysis provides knowledge of a firm’s operating and financial structure • This aids in estimating future returns
Major Financial Statements • Corporate annual reports must include: • Statement of Financial Position • Income statement • Statement of cash flows • Enough for analysis?
Purpose of Financial Statement Analysis • Evaluate management performance in • Profitability • Efficiency • Risk • Although financial statement information is historical, it is used to project future performance
Five Categories of Financial Ratios • Common size statements • Internal liquidity (solvency) • Operating performance • Operating profitability • Operating efficiency • Risk analysis • Business risk • Financial risk • Growth analysis
Common Size Statements • Normalize balance sheets and income statement items to allow easier comparison of different size firms • A common size balance sheet expresses accounts as a percentage of total assets • A common size income statement expresses all items as a percentage of sales
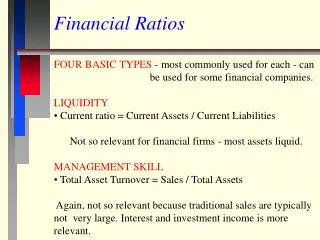
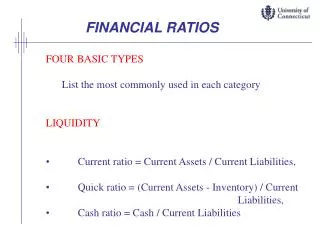
Evaluating Internal Liquidity • Internal liquidity (solvency) ratios indicate the ability to meet future short-term financial obligations • Current Ratio • Quick Ratio • Cash Ratio
Evaluating Operating Performance • Ratios that measure how well management is operating a business • Operating profitability ratios • Examine how management is doing at controlling costs so that a large proportion of the sales dollar is converted into profit • Operating efficiency ratios • Examine how management uses its assets to generate sales; considers the relationship between various asset categories and sales
Operating Profitability Ratios • Operating profitability ratios measure • Gross profit margin • Operating profit margin • Net profit margin • Return on owner’s equity (ROE)
Operating Efficiency Ratios • How effectiveness of a firm’s use of its total asset base to produce sales • Total asset turnover • Non-current asset turnover • Operating cycle • Cash conversion cycle
Operating Cycle & Cash Conversion Cycle Raw material purchased Order Placed Stock Arrives Inventory period Accounts receivable period Cash conversion cycle Cash received Finished goods sold Time Accounts payable period Firm receives invoice Cash paid for materials Operating cycle
Operating Profitability Ratios • Return on owner’s equity (ROE) indicates the rate of return earned on the capital provided by the stockholders after paying for all other capital used
Operating Profitability Ratios • The DuPont System divides ROE into several ratios that collectively equal ROE while individually providing insight • An extended DuPont System provides additional insights into the effect of financial leverage on the firm and pinpoints the effect of income taxes on ROE
Profit Total Asset Financial Margin Turnover Leverage x x = Operating Profitability Ratios
Risk Analysis • Risk analysis examines the uncertainty of income for the firm and for an investor • Total firm risks can be decomposed into two basic sources: • Business risk: The uncertainty in a firm’s operating income, highly influenced by industry factors • Financial risk: The added uncertainty in a firm’s net income resulting from a firm’s financing decisions
Business Risk • Variability of the firm’s operating income over time Two primary determinants of business risk • Sales variability • The main determinant of earnings variability • Cost Variability and Operating leverage • Production has fixed and variable costs • Greater fixed production costs cause greater profit volatility with changes in sales • Fixed costs represent operating leverage • Greater operating leverage is good when sales are high and increasing, but bad when sales fall
Rev. Rev. $ $ } TC Profit TC FC FC QBE QBE Sales Sales Effect of operating leverage • More operating leverage leads to more business risk, for then a small sales decline causes a big profit decline. • What happens if variable costs change?
Financial Risk • Interest payments are deducted before we get to net income • These are fixed obligations • Similar to fixed production costs, these lead to larger earnings during good times, and lower earnings during a business decline • Fixed financing costs are called financial leverage • The use of debt financing increases financial risk and possibility of default
Financial Risk • Two sets of financial ratios help measure financial risk • Balance sheet ratios • Earnings or cash flow available to pay fixed financial charges • Acceptable levels of financial risk depend on business risk • A firm with considerable business risk should likely avoid lots of debt financing
Financial Risk • Balance Sheet Ratios • Total debt ratio • Debt-equity ratio • Equity multiplier • Earnings or cash flow available to pay fixed financial charges • Times interest earned ratio • Cash coverage ratio
Potential Growth Analysis • Important to both creditors and owners • ability to pay future obligations • Ability to pay dividends g = ROE x Retention rate • The retention rate is one minus the firm’s dividend payout ratio • Anything that impacts ROE would also be a determinant of future growth
Importance of Relative Financial Ratios • In order to make sense of a ratio, we must compare it with some appropriate benchmark or benchmarks • Examine a firm’s performance relative to: • The aggregate economy • Its industry or industries • Its major competitors within the industry • Its own past performance (time-series analysis)
Comparing to the Aggregate Economy • Most firms are influenced by economic expansions and contractions in the business cycle • Analysis helps you estimate the future performance of the firm during subsequent business cycles
Comparing to the Industry Norms • Most popular comparison • Industries affect the firms within them differently, but the relationship is always significant • The industry effect is strongest for industries with homogenous products • Can also examine the industry’s performance relative to aggregate economic activity
Comparing to the Firm’s Major Competitors • Industry averages may not be representative • A firm may operate in several distinct industries • Several approaches: • Select a subset of competitors for the comparison group • Construct a composite industry average from the different industries in which the firm operates
Comparing to the Firm’s Own Past Performance • Determine whether it is progressing or declining • Helpful for estimating future performance • Consider trends as well as averages over time
Other than financial statements • Corporate Profile • Chairman’s Statement • Management Discussion and Analysis • Notes to Financial Statements • Segment information • Noncurrent assets component • Any commitments, etc. • Government & Industry Statistics • Your Observation
Is financial performance everything? • Financial performance may lead management’s emphasis on short-run financial performance • Need to have some measures that translate an organisation’s mission and strategy into a comprehensive set of performance measures.
Other perspectives • Four key perspectives: • Financial • Customer • Internal business processes • Learning and growth
Other perspectives • Because the non-financial and operational indicators measure fundamental changes that a company is making. • The financial benefits of these fundamental changes may not be captured in short-run earnings. • Strong improvements in non-financial measures signal the prospect of creating economic value in the future.