Download

1 / 46
460 likes | 613 Views
Chemical and spatial resolution with a SNOM introduction to near field optics aperture SNOM SNOM tips apertureless SNOM applications in solid state phisics some examples in biology. Snell law 1. Total reflection in a prism Classically Snell law:

E N D
Chemical and spatial resolution with a SNOMintroduction to near field optics aperture SNOMSNOM tipsapertureless SNOM applications in solid state phisicssome examples in biology
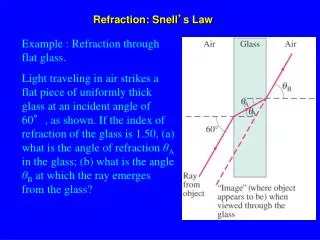
Snell law 1 Total reflection in a prism Classically Snell law: No light is classically trasmitted in a medium of lower refractive index when a critical angle is reached: n2 n1 n2 n1
E k z x y Snell law 2 n2 = n TM = linear polarization in the plane Oxz • The transmitted polarization is along z n1 = 1 • The wave vector along z is immaginary: exponential decay • The wave vector along x is higher than w/c • Notice that high k means small l: higher spatial resolution
ê Angular spectrum • Decomposition of the field in plane waves at z constant • The field should satisfy the Helmholtz equation • Fourier component can be written as: • The evolution along z can be deduced by the field at z=0
ê Angular spectrum 2 Where from Helmholtz equation: w is imaginary! This expression of the electric field is general: no approximations have been used until now uand v arespatial frequencies w introduces a decaying exponential in the expression of the Field vs z
ê Angular spectrum 3 Example 1: 1D periodic grating y We measure the field intensity far away form O along the z axis x z In y direction there is no modulation so the only spatial frequency allowed is v=0; in x direction u assumes discrete values n/d n=1,2,…n. The only wave vector allowed are etc. Those values represent the nth diffraction order of the grating If d<l w becomes imaginary and the only propagating wave vector is (0,0,0) and the grating is no longer diffracted. The spatial information is retained only in the near field
y x z ê Angular spectrum 4 Example 2: propagation through a small squared aperture F 0 slowly at high spatial frequency: sharp edges. F has a maximum for u,v (0,p/a) but, when a<l/2 And the part or all the light that maximizes F cannot propagate Again, The spatial information is retained only in the near field
Near field detection How to detect the near filed if it not propagating? Theorem of reciprocity [Time reversibility of the Maxwell equation] If a plane wave is diffracted into an evanescent wave by a subwavelenght scatterer, A subwavelenght scatterer should be diffracted into a propagating wave by the same object
Illumination Near field detection Sample surface • Aperture SNOM • The light is collected near the sample by a tapered optical fiber with a subwavelenght aperture • Low light throughput • Resolution limited to l/10 Physical mechanism SPATIAL FILTERING • True spectroscopic information (including PL, EL, etc) • Dependence only on the tip geometrical properties • No dependance on the tip physical properties • No wavelenght dependence
Aperture SNOM • The near field decays exponentially with distance • The tip should be kept at a controllede distance from the sample surface • Feed back mechanism: shear force (similar to AFM tapping mode) • Feedback detection: quartz oscillator (STM current is not suitable for biological samples; optical methods are disturbing the optical response). Electrodes Piezo actuator Impedance detector Feedback xyz piezo
Transmission collection Transmission illumination Illumination collection Reflection collection Illumination Collection • Aperture SNOM • Operational modes
Optical fiber Laser Pol. control feedback control Topographic image xyz Scanner nf optical image Inverted optical microscope Detector • Aperture SNOM • Typical set up Monochromator
Turner etching method Al coating Hydrofluoric acid Chemical etching Glass heating Heating and pulling method Aluminum vapor pulling breaking • Aperture SNOM • SNOM tips Optical fiber
Aperture SNOM • SNOM tips • Calculation of the distribution of electric field as a function of the tip geometry Source: InAs Qdot Point like source l/40 below the surface
Light propagation • Aperture SNOM • SNOM tips - pulling Metal coating Core Cladding
Aperture SNOM • SNOM tips - etching Metal coating Core Light propagation Cladding Holes are dug by various methods: The best results are obtained by FIB
Aperture SNOM • Photopolimerization • 90% wt Pentaerythritol triacrylate (monomer) • 8% wt methyldiethanolamine (cosynergist) • 2% wt eosin (dye) • High sensitivity to the argon laser light (514 nm) • SNOM tips - polymerization Metal coating Core Light propagation Cladding
Aperture SNOM • SNOM “japanese” etching Three different etching steps Solution NH4F:HF:H2O X : 1 : 1 X=10 angle 20o X=2.7 angle 50o The selectivity between core and cladding comes from different quartz doping with Ge
Aperture SNOM • Application1: blood cell with malaria disease Study of blood cells infected by malaria’s plasmodium falciparium.(PF) Pf expresses several proteins in particular PfHRP1 and MESA that arefixed on the cell membrane. Proteins on cell membrane are colored with specific antibody marked with a red and a green fluorophor Here PfHRP1 is marked red
Aperture SNOM • Application1: blood cell with malaria disease Comparison between SNOM and confocal microscope images in the sdame blood cell: SNOM is sensitive to cell surface CM images a plane section at the focal plane Cellular structure is resolved on the SNOM image but not in CF image
Aperture SNOM • Colocalization of host membrane and PF proteins • Control experiment: • PfHRP1 is bound with antibodies marked either with green or red. The perfect overlap excludes any instrumental effect • Colocalization of host protein (green) and MESA protein (red) • good colocalization Mesa and host proteins interact oin the cell surface • Colocalization of host protein (green) and PfHRP1 protein (red) • No interaction at the cell membrane • NB the three ijmages refers to different blood cells groups • Application1: blood cell with malaria disease
Aperture SNOM • Application2: single molecule detection and FRET mechanism
Aperture SNOM • Application2: single molecule detection and FRET mechanism Green and red spot are due to not hybridized ssDNA (red can also arise from complete FRET effect) Yellow spot arise from hybridized dsDNA with competing green and red emission
Aperture SNOM The experiment: Testing the subwavelkenght modulation induced on the local density of states of the optical modes by the fabrication of nanometric opticla corrals Substrate ITO Modulators 100nm100nm50nm gold particles deposited by e-beam lithography • Application3: optical quantum corral To test the real LDOS the tip should act as a perfetct dipole at a nanometric distance from the surface. Real tips always pertirb the LDOS and what is measured is the combined LDOS of the sample and the tip!
Aperture SNOM • Application3: optical quantum corral Light Polarization control Elliptical mirros that selects only the near field radiation (propagating radiation is not allowed in the “forbidden light region with q>qc The signal is 0 only closo to the sample
Aperture SNOM • Application3: optical quantum corral Teorical optical LDOS in x, y and z direction
Aperture SNOM Near field results in trasmission. Best results obtained with a gold coated tip without apertures (the tip At the tip the polarization is tilted along z The Snom data are fitted with a 1:4 mixing of the zx,y) polarization • Application3: optical quantum corral
Aperture SNOM • Application4: excitonic wave function of a quantum dot Low temperature operation Illumination collection mode
Aperture SNOM • Application4: excitonic wave function of a quantum dot Different emission spectra at increasing power (LEFT) and on different dots (Right) The far field spectra average the different contribution and the structure is lost
Aperture SNOM • Application4: excitonic wave function of a quantum dot Excitonic wave function mapping of different dots showing that bi-exciton is more confined A weak alignment along (1-10) crystallographic direction can be noticed
Near field detection Apertureless SNOM • Scattering SNOM Unlimited resolution Chemical sensitive Physical mechanism: TIP-SAMPLE INTERACTION Strong wavelenght dependence Strong dependance on the tip physical properties
s-SNOM We model the tip as a metallic sphere Assuming that l >>a and using a quasi-electrostatic theory Tip polarization far away from the sample in an external electric field E Dipole induced on the sample surface Dipole induced on the sample surface
s-SNOM In a first order iterative process the dipole induced on the tip becomes The total dipole (tip + sample) is that is having an effective polarizability In the case of field parallel to the surface the induced dipole is opposite to the field and the effective polarizability is In a metal b 1 and aeff is nearly 0
s-SNOM It is evident that aeff is increased by the interaction only for z<<a, In other words when the tip very close to the surface
s-SNOM The measurable quantities are the scattered and the absorbed light that is proportional to the cross section. Applying Mie theory of light scattering Scatteing and absorption cross section for a gold sphere on gold and silicon substrates for normal and parallel polarization If I’m able to scan a gold sphere close to the sample surface I can observe a contrast in scattered intensity and, therefore, a can obtain a chemical map of the surface
s-SNOM • Typical experimental set-up • The main problem is that the light scattered by the tip that carries the information on tip-sample interaction is overwhelmed by background light by several orders of magnitude
s-SNOM The dependence of a(z) is not linear. Oscillating the tip in a non contact mode (harmonic) fashion, a non-harmonic response is obtained. The non-harmonicity increases with the oscillation amplitude. By collecting the nth armonic signal (n>3) the near field signal can be obtained
s-SNOM • It works! On the left the 1st harmonic signal is collected at fixed amplitude while changing the tip-sample distance. Even for tip-sample distance > 200nm ther is a huge signal, arising from cantilever scattering and independent of tip-sample interaction On the right the 2nd harmonic is collected, the background is suppressed and the near field signal is restricted to a 20nm distance from the surface. l=633nm
s-SNOM Lateral resolution and chemical contrast Pattern of Au on silicon obtained by evaporation through a polystyrene lattice. The chemical contrast arise from differences in the dielectric constant value at 633nm. BUT Topographic effects are not excluded: It is true chemical contrast? (This is a big issue in SNOM and the major source of SNOM artifacts) l=633nm
s-SNOM 800nm True chemical contrast Silicon surface with a laterally modulated p-n doping structure. The topogarphic contrast is just 0.1nm: the surface can be told to be flat, so the contrast is purely otpical/chemical The optical-spatial resolution is about 50 nm l is 10mm So the resolution approaches l/200
Near field detection Apertureless SNOM • Tip-enhanced SNOM Unlimited resolution Physical mechanism: FIELD ENHANCEMENT Suitable only for particular light-matter interaction process (e.g. Raman scattering, second harmonic generation, etc Where the light detected has a different wavelenght from the excitation light.) Strong analogy to SERS and SPR
Near field detection • Field enhancement on a tip apex • Antenna effect
te-SNOM • Set-up for tip-enhanced SNOM
te-SNOM • Raman scattering from a single CNT Here the excitation is localized, while the light scattered by the nanotube is then collected in far field through the optical microscope. • Confocal microscope • SNOM raman image taken at the G’ band wavelenght With metal tip without
te-SNOM • Raman scattering from a single CNT Localization of radial breathin mode raman scattering along the nanotube a and b arc-discharge growth b and d CVD growth Structural defects along the structure can be identified by raman snom experiment
te-SNOM Confocal vs SNOM microscopy AND SNOM WINS!!!!!!!! +