Download
1 / 1
10 likes | 130 Views
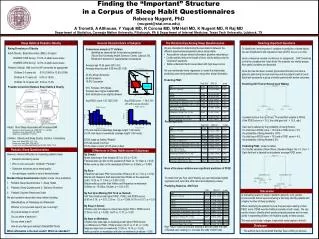
Finding the “Important” Structure in a Corpus of Sleep Habit Questionnaires Rebecca Nugent, PhD (rnugent@stat.cmu.edu) A Tronetti, A Althouse, Y Yaqub MD, R Corona MD, WM Hall MD, K Nugent MD, R Raj MD

E N D
Finding the “Important” Structure in a Corpus of Sleep Habit Questionnaires Rebecca Nugent, PhD (rnugent@stat.cmu.edu) A Tronetti, A Althouse, Y Yaqub MD, R Corona MD, WM Hall MD, K Nugent MD, R Raj MD Department of Statistics, Carnegie Mellon University, Pittsburgh, PA & Department of Internal Medicine, Texas Tech University, Lubbock, TX General Characteristics of Subjects Selecting Important Questions Sleep Habits & Pediatric Obesity The Relationships Among Sleep Questionnaires • We are interested in determining the associations between the different questionnaires/questions about sleep habits. • Associations indicate shared information (possible redundancy) • Could possibly reduce the length of clinic visit by asking only the • “important” questions • Better understand factors associated with high sleep scores • We use multivariate linear regression to model the relationship predicting each sleep questionnaire using other sleep information. • Predicting PSQ1: • Coef. Est 95% CI p-val Rising Prevalence of Obesity Adult Obesity: Body Mass Index (BMI) > 30 kg/m2 NHANES 1980 Survey: 15.0% of adults were obese NHANES 2004 Survey: 32.9% of adults were obese Pediatric Obesity: BMI over the 95th percentile for age/gender Children 2-5 years old: 5.0% (1980) to 13.9% (2004) Children 6-11 years old: 6.5% to 18.8% Children 12-19 years old: 5.0% to 17.4% Possible Connection Between Sleep Habits & Obesity To identify the “most important” variables in prediction of sleep habits, we use classification and regression trees (CART, Breiman et al 1984) Given a response variable (continuous or categorical), CART searches to find the variables that “best divide” the subjects into similar groups. Non-useful variables are discarded. Once the tree has been created, physicians/clinicians can trace a patient’s path along the tree branches until the patient’s leaf is found. Each leaf represents a group of similar patients with similar outcomes. Predicting Still Tired or Rested Upon Waking: Convenience sample of 77 children Identified as obese/at-risk for obesity by pediatrician (Texas Tech University Health Sciences Center, Lubbock,TX) Referred to dietician for supplemental consultations Average age 10.36 years (SD 3.43) Average sleep duration 9.08 hrs (SD 1.09) 23.4% African-American 55.8% Hispanic 19.5% Caucasian 61% Females, 39% Males Females have higher median BMI; Both distributions are slightly skewed Avg PSQ1 score: 5.27 (SD 2.99) Avg PSQ2 score: 1.78 (1.85) (21 with a score of zero) A patient starts at the top of tree. The best/first variable is PDSS. If the PDSS score is < 15.5, the child goes left. > 15.5, right. Each leaf is labeled by the probability of being Rested. If a child has a PDSS score < 15.5 and a PSQ2 score < 0.5, the probability of being Rested is 100%. If a child has a PDSS score > 15.5 and a PSQ1 score > 4.5, the probability of being Rested is 0%. Predicting PSQ1: (lower is better) For Yes/No variables (Share Room, Weekend Naps): No = 0, Yes = 1. Each final leaf is labeled by its patients’ average PSQ1 score. Predicting PDSS: Coef. Est 95% CI p-val Taheri, S Arch Dis Child 2006;91:881-884 Adults: Short Sleep Associated with Increased BMI Buscemi, Kumar, Nugent, et al. JCSM 2007; 3, 7, 681-688 Gangswich, et al. Sleep 2005; 28: 1289-96. Singh, et al. JCSM 2005; 1: 357-63 Children: Obesity and Sleep Quality, Duration, Consistency Nixon, et al. Sleep 2008; 31(1); 71-8. Hasler, et al. Sleep 2004; 27(4): 661-6. Locard, et al. Int J Obes Relat Metab Disord 1992; 16(10): 721-9. 27% took naps on weekdays (average length 1.34 hours); 23.3% took naps on weekends (average length 1.59 hours). 55.8% wake up feeling “Rested”. 20% fall asleep in school. 58.3% share a room; 28.3% share a bed. Pediatric Sleep Questionnaires Differences in Sleep Habits across Subgroups • However, inherent difficulties in measuring pediatric sleep • Recall/inconsistency issues • Who is more accurate? Children? Parents? • Subjective decisions about sleep quality • Survey fatigue; inability or lack of desire/interest By Gender: Males slept longer than females (9.5 vs. 8.8; p = 0.04) Females woke up later on the weekend (9:10am vs. 10:15am; p = 0.03) Males woke up later on the weekdays (6:45am vs. 6:30am; p = 0.097) By Race: Hispanics had lower PSQ1 scores than Whites (4.47 vs. 7.40; p = 0.03). Blacks and Hispanics both slept less than Whites on the weekends (9.63, 10.22 vs. 11.5 hrs; p = 0.003, 0.02). Blacks woke up earlier than Whites and Hispanics on weekends (8:56am vs. 10:33am, 9:42am; p = 0.04, 0.07) By Feel Upon Waking (Still Tired vs. Rested): Still Tired children had higher PSQ1, PSQ2, and PDSS scores (6.65 vs 3.76, p < 0.01; 2.39 vs. 1.5, p = 0.089; 16.78 vs 10.17, p < 0.01) By Sleep in School: Children who fall asleep in school have higher PSQ1, PDSS scores (7.08 vs. 4.81, p = 0.026; 15.67 vs. 11.77, p < 0.01) By Naps on Weekdays: Children who take naps on weekdays had higher PDSS scores (no difference on PSQ1, PSQ2 scores) (14.31 vs. 11.91, p = 0.06) Nappers slept more on weekends (11.06 vs. 10.14, p = 0.24); woke up earlier on weekdays and later on weekends (p-values ~ 0.08) None of the sleep variables were significant predictors of PSQ2. To model how you Feel Upon Waking, we use multivariate logistic regression and report the odds ratios and adjusted p-values. Predicting Rested vs. Still Tired: OR 95% CI p-val • Standard Sleep Questionnaires (higher scores, more problems) • Pediatric Sleep Questionnaire 1: Sleep Habits • 2. Pediatric Sleep Questionnaire 2: Behavior Problems • 3. Pediatric Daytime Sleepiness Scale • We add questions about daily sleep habits including: • Wake/Bedtime on Weekdays and Weekends • Whether or not you take naps (if yes, how long?) • Do you fall asleep in school? • Do you share a bedroom? • Do you share a bed? • How do you feel upon waking? (Rested/Still Tired) • Which information is the most useful? Which is redundant? Discussion In evaluating quality of sleep in pediatric patients, race, gender, environmental factors such as sharing a bed help identify patients with a higher number of sleep problems. When classifying the patients by how they feel upon waking or their PSQ1 score, PDSS was the first/best variable in both cases. We can use the trees to identify which questions/questionnaires are the most useful in separating children into high/low quality of sleep groups. This was a pilot study; a larger, longitudinal study begins in the fall. Disclosure High PSQ1, PDSS scores and Sharing a Bed decrease the odds of Rested upon waking (i.e. increase the odds of Still Tired). The authors have documented that they have nothing to disclose.