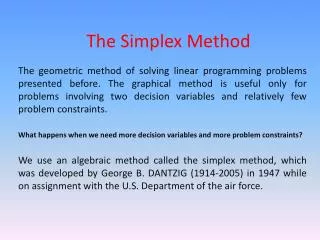

The Simplex Method for Standard Maximization Problems
E N D
Presentation Transcript
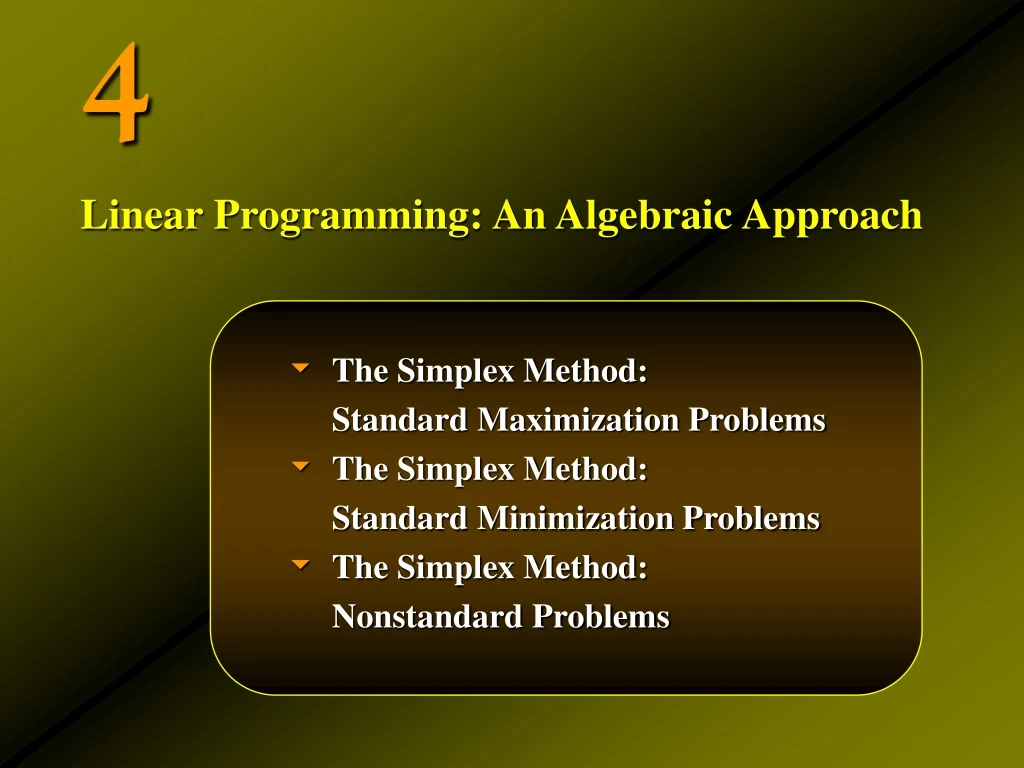
4 • The Simplex Method: Standard Maximization Problems • The Simplex Method: Standard Minimization Problems • The Simplex Method: Nonstandard Problems Linear Programming: An Algebraic Approach
4.1 The Simplex Method: Standard Maximization Problems
The Simplex Method • The simplex method is an iterative procedure. • Beginning at a vertex of the feasible regionS, each iteration brings us to another vertex of S with an improved value of the objective function. • The iteration ends when the optimal solution is reached.
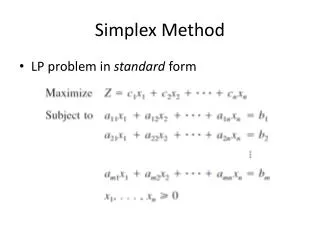
A Standard Linear Programming Problem • A standard maximization problem is one in which • The objective function is to be maximized. • All the variables involved in the problem are nonnegative. • All other linear constraints may be written so that the expression involving the variables is less than or equal toa nonnegative constant.
Setting Up the Initial Simplex Tableau • Transform the system of linearinequalities into a system of linearequations by introducing slack variables. • Rewrite the objective function in the form where all the variables are on the left and the coefficient of P is +1. Write this equation below the equations in step 1. • Write the augmented matrix associated with this system of linear equations.
Applied Example 1: A Production Problem • Recall the production problem discussed in Chapter 3, which required us to maximize the objective function subject to the system of inequalities • This is a standard maximization problem and may be solved by the simplex method. • Set up the initial simplex tableau for this linear programming problem. Example 1, page 206
Applied Example 1: A Production Problem Solution • First, introduce the slack variablesu and v into the inequalities and turn these into equations, getting • Next, rewrite the objective function in the form Example 1, page 206
Applied Example 1: A Production Problem Solution • Placing the restated objective function below the system of equations of the constraints we get • Thus, the initial tableau associated with this system is Example 1, page 206
The Simplex Method • Set up the initial simplex tableau. • Determine whether the optimal solution has been reached by examining all entries in the last row to the left of the vertical line. • If all the entries are nonnegative, the optimal solutionhas been reached. Proceed to step 4. • If there are one or more negative entries, the optimal solutionhas not been reached. Proceed to step 3. • Perform the pivot operation. Return to step 2. • Determine the optimal solution(s).
Applied Example 1: A Production Problem • Recall again the production problem discussed previously. • We have already performed step 1 obtaining the initial simplex tableau: • Now, complete the solution to the problem. Example 2, page 208
Applied Example 1: A Production Problem Solution Step 2. Determine whether the optimal solution has been reached. • Since there are negative entries in the last row of the tableau, the initial solution is not optimal. Example 2, page 208
Applied Example 1: A Production Problem Solution Step 3. Perform the pivot operation. • Since the entry –6/5isthe most negative entry to the left of the vertical line in the last row of the tableau, the second column in the tableau is the pivot column. Example 2, page 208
Applied Example 1: A Production Problem Solution Step 3. Perform the pivot operation. • Divide each positive number of the pivot column into the corresponding entry in the column of constants and compare theratios thus obtained. • We see that the ratio300/3 = 100 is less than the ratio180/1 = 180, so row 2 is the pivot row. Example 2, page 208
Applied Example 1: A Production Problem Solution Step 3. Perform the pivot operation. • The entry3 lying in the pivot column and the pivot row is the pivot element. Example 2, page 208
Applied Example 1: A Production Problem Solution Step 3. Perform the pivot operation. • Convert the pivot element into a 1. Example 2, page 208
Applied Example 1: A Production Problem Solution Step 3. Perform the pivot operation. • Convert the pivot element into a 1. Example 2, page 208
Applied Example 1: A Production Problem Solution Step 3. Perform the pivot operation. • Use elementary row operations to convert the pivot column into a unit column. Example 2, page 208
Applied Example 1: A Production Problem Solution Step 3. Perform the pivot operation. • Use elementary row operations to convert the pivot column into a unit column. Example 2, page 208
Applied Example 1: A Production Problem Solution Step 3. Perform the pivot operation. • This completes an iteration. • The last row of the tableau contains a negative number, so an optimal solutionhasnot been reached. • Therefore, we repeat the iteration step. Example 2, page 208
Applied Example 1: A Production Problem Solution Step 3. Perform the pivot operation again. • Since the entry –3/5isthe most negative entry to the left of the vertical line in the last row of the tableau, the first column in the tableau is now the pivot column. Example 2, page 208
Applied Example 1: A Production Problem Solution Step 3. Perform the pivot operation. • Divide each positive number of the pivot column into the corresponding entry in the column of constants and compare the ratios thus obtained. • We see that the ratio80/(5/3) = 48 is less than the ratio100/(1/3) = 300, so row 1 is the pivot row now. Ratio Example 2, page 208
Applied Example 1: A Production Problem Solution Step 3. Perform the pivot operation. • The entry5/3 lying in the pivot column and the pivot row is the pivot element. Example 2, page 208
Applied Example 1: A Production Problem Solution Step 3. Perform the pivot operation. • Convert the pivot element into a 1. Example 2, page 208
Applied Example 1: A Production Problem Solution Step 3. Perform the pivot operation. • Convert the pivot element into a 1. Example 2, page 208
Applied Example 1: A Production Problem Solution Step 3. Perform the pivot operation. • Use elementary row operations to convert the pivot column into a unit column. Example 2, page 208
Applied Example 1: A Production Problem Solution Step 3. Perform the pivot operation. • Use elementary row operations to convert the pivot column into a unit column. Example 2, page 208
Applied Example 1: A Production Problem Solution Step 3. Perform the pivot operation. • The last row of the tableau contains no negative numbers, so an optimal solutionhas been reached. Example 2, page 208
Applied Example 1: A Production Problem Solution Step 4. Determine the optimal solution. • Locate the basic variables in the final tableau. In this case, the basic variables are x, y, and P. • The optimal value for x is 48. • The optimal value for y is 84. • The optimal value for P is 148.8. • Thus, the firm will maximize profits at $148.80 by producing 48type-A souvenirs and 84 type-B souvenirs. This agrees with the results obtained in chapter 3. Example 2, page 208
4.2 The Simplex Method: Standard Minimization Problems
Minimization with Constraints • In the last section we developed the simplex method to solve linear programming problems that satisfy three conditions: • The objective function is to be maximized. • All the variables involved are nonnegative. • Each linear constraint may be written so that the expression involving the variables is less than or equal to a nonnegative constant. • We will now see how the simplex method can be used to solve minimization problems that meet the second and third conditions listed above.
Example • Solve the following linear programming problem: • This problem involves the minimization of the objective function and so is not a standard maximization problem. • Note, however, that all the other conditions for a standard maximizationhold true. Example 1, page 226
Example • We can use the simplex method to solve this problem by converting the objective function from minimizingC to its equivalent of maximizingP= –C. • Thus, the restatedlinear programming problem is • This problem can now be solved using the simplex method as discussed in section 4.1. Example 1, page 226
Example Solution Step 1. Set up the initial simplex tableau. • Turn the constraints into equations adding to them the slack variablesu and v. Also rearrange the objective function and place it below the constraints: • Write the coefficients of the system in a tableau: Example 1, page 226
Example Solution Step 2. Determine whether the optimal solution has been reached. • Since there are negative entries in the last row of the tableau, the initial solution is not optimal. Example 1, page 226
Example Solution Step 3. Perform the pivot operation. • Since the entry –3isthe most negative entry to the left of the vertical line in the last row of the tableau, the second column in the tableau is the pivot column. Example 1, page 226
Example Solution Step 3. Perform the pivot operation. • Divide each positive number of the pivot column into the corresponding entry in the column of constants and compare the ratios thus obtained. • We see that the ratio10/2 = 5 is less than the ratio 32/4 = 8, so row 2 is the pivot row. Ratio Example 1, page 226
Example Solution Step 3. Perform the pivot operation. • The entry2 lying in the pivot column and the pivot row is the pivot element. Example 1, page 226
Example Solution Step 3. Perform the pivot operation. • Convert the pivot element into a 1. Example 1, page 226
Example Solution Step 3. Perform the pivot operation. • Convert the pivot element into a 1. Example 1, page 226
Example Solution Step 3. Perform the pivot operation. • Use elementary row operations to convert the pivot column into a unit column. Example 1, page 226
Example Solution Step 3. Perform the pivot operation. • Use elementary row operations to convert the pivot column into a unit column. Example 1, page 226
Example Solution Step 3. Perform the pivot operation. • This completes an iteration. • The last row of the tableau contains a negative number, so an optimal solutionhasnot been reached. • Therefore, we repeat the iteration step. Example 1, page 226
Example Solution Step 3. Perform the pivot operation. • Since the entry –1/2isthe most negative entry to the left of the vertical line in the last row of the tableau, the first column in the tableau is now the pivot column. Example 1, page 226
Example Solution Step 3. Perform the pivot operation. • Divide each positive number of the pivot column into the corresponding entry in the column of constants and compare the ratios thus obtained. • We see that the ratio12/3 = 4 is less than the ratio 5/(1/2) = 10, so row 1 is now the pivot row. Example 1, page 226
Example Solution Step 3. Perform the pivot operation. • The entry3 lying in the pivot column and the pivot row is the pivot element. Example 1, page 226
Example Solution Step 3. Perform the pivot operation. • Convert the pivot element into a 1. Example 1, page 226
Example Solution Step 3. Perform the pivot operation. • Convert the pivot element into a 1. Example 1, page 226
Example Solution Step 3. Perform the pivot operation. • Use elementary row operations to convert the pivot column into a unit column. Example 1, page 226
Example Solution Step 3. Perform the pivot operation. • Use elementary row operations to convert the pivot column into a unit column. Example 1, page 226
Example Solution Step 3. Perform the pivot operation. • The last row of the tableau contains no negative numbers, so an optimal solutionhas been reached. Example 1, page 226