Download
1 / 11
110 likes | 129 Views
Team LYF introduces a Python package for detecting earthquake events efficiently. The package utilizes parallel computing and offers a simple, reusable solution for waveform analysis. The workflow includes selecting study regions, cross-correlation analysis, and output processing. Explore this innovative approach for seismic event detection!

E N D
Team LYF:Applying Python toWaveform Matching DetectionXin Liu (USC), Dongdong Yao(GT), Lili Feng(CU-Boulder)
Motivation Bottlenecks: • Large disk usage for saving event and continuous waveforms (up to TB or more) • Large potential computational cost (up to months, even years computation) • Quality control of the available data (Need to be done...) Proposed Solutions: • Dynamically fetcing the data and getting the result without saving tons of data • Parallel computing (mpi, gpu) • Monitoring the data quality while fetcing the data (Need to be done...)
Our Goal Write a simple, concise and reusable package for detecting earthquake events and future work Use object-oriented Python and divide a big job of multiple stages to multiple classes Use IRIS FDSN web service and get stacked detection trace with a single run
Work Flow select study region: • choose available earthquakes(template) • search nearby stations • determine study period sliding window cross-correlation: • fetch template waveform • predict arrivals, and compute SNR • check corresponding continuous data(hourly/daily) • operate the cross-correlation stack and output: • stack over all channels • output positive detections(MAD)
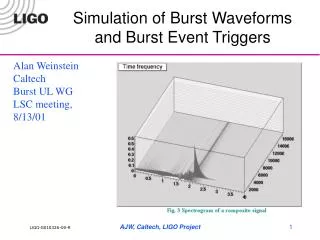
Algorithm Template (35 sec): P(t) Continuous data (one day here): C(t) Correlation with template (frequency domain) Apply moving average filter F(t) (35 sec) all 1s!
35 s Waveform 1 day Correlation coefficient (CC) trace courtesy XiaofengMeng
Stacked CC trace courtesy Xiaofeng Meng
Simple Test Event: 2015/04/12 02:23:05.15 Ohio M3.2
Any question or comment? Future work • More interactive quality control of the waveforms • Utilize the parallel computing • Improve the current code (stacking, etc.) • Store detection information in SQL database