Download
1 / 17
170 likes | 256 Views
Explore the principles of uniform and normal distributions in probability analysis with real-world examples and applications. Learn how to calculate probabilities and solve problems using these key continuous probability distributions.

E N D
Lecture 1Uniform and Normal Distributions Walpole Chapter 6 Continuous Probability Distributions
Continuous Probability Distributions • Many continuous probability distributions, including: • Uniform • Normal • Gamma • Exponential • Chi-Squared • Lognormal • Weibull Weibull PDF Source: www.itl.nist.gov EGR 252 Fall 2018
Uniform Distribution • Simplest – characterized by the interval endpoints, A and B. A ≤ x ≤ B = 0 elsewhere • Mean and variance: and EGR 252 Fall 2018
Example: Uniform Distribution A circuit board failure causes a shutdown of a computing system until a new board is delivered. The delivery time X is uniformly distributed between 1 and 5 days. What is the probability that it will take 2 or more days for the circuit board to be delivered? EGR 252 Fall 2018
In Class Examples • 6.3 EGR 252 Fall 2018
Normal Distribution • The “bell-shaped curve” • Also called the Gaussian distribution • The most widely used distribution in statistical analysis • forms the basis for most of the parametric tests we’ll perform later in this course. • describes or approximates most phenomena in nature, industry, or research • Random variables (X) following this distribution are called normal random variables. • the parameters of the normal distribution are μand σ(sometimes μand σ2.) EGR 252 Fall 2018
(μ = 5, σ = 1.5) Normal Distribution • The density function of the normal random variable X, with mean μ and variance σ2, is all x. EGR 252 Fall 2018
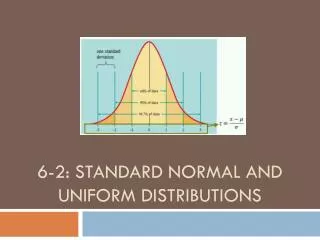
Standard Normal RV … • Note: the probability of X taking on any value between x1 and x2 is given by: • To ease calculations, we define a normal random variable where Z is normally distributed with μ = 0 and σ2= 1 EGR 252 Fall 2018
Standard Normal Distribution • Table A.3 Pages 735-736: “Areas under the Normal Curve” EGR 252 Fall 2018
Examples • P(Z ≤ 1) = • P(Z ≥ -1) = • P(-0.45 ≤ Z ≤ 0.36) = EGR 252 Fall 2018
Name:________________________ • Use Table A.3 to determine (draw the picture!) 1. P(Z≤ 0.8) = 2. P(Z≥ 1.96) = 3. P(-0.25 ≤ Z≤ 0.15) = 4. P(Z ≤ -2.0 orZ≥ 2.0) = EGR 252 Fall 2018
Applications of the Normal Distribution • A certain machine makes electrical resistors having a mean resistance of 40 ohms and a standard deviation of 2 ohms. What percentage of the resistors will have a resistance less than 44 ohms? • Solution: Xis normally distributed with μ = 40 and σ= 2 and x = 44 P(X<44) = P(Z< +2.0) = 0.9772 Therefore, we conclude that 97.72% will have a resistance less than 44 ohms. What percentage will have a resistance greater than 44 ohms? EGR 252 Fall 2018
The Normal Distribution “In Reverse” • Example: Given a normal distribution with μ = 40 and σ = 6, find the value of X for which 45% of the area under the normal curve is to the left of X. Step 1 If P(Z < z) = 0.45, z = _______ (from Table A.3) Why is z negative? Step 2 X = _________ 45% EGR 252 Fall 2018
In-Class Exercise 6.14 The finished inside diameter of a piston ring is normally distributed with a mean of 10 centimeters and a standard deviation of 0.03 centimeter. • What proportion of rings will have inside diametersexceeding 10.075 centimeters? (b) What is the probability that a piston ring will havean inside diameter between 9.97 and 10.03 centimeters? (c) Below what value of inside diameter will 15% of thepiston rings fall?of 0.03 centimeter. EGR 252 Fall 2018
In-Class Exercise 6.14 Solution • What proportion of rings will have inside diametersexceeding 10.075 centimeters? (b) What is the probability that a piston ring will havean inside diameter between 9.97 and 10.03 centimeters? (c) Below what value of inside diameter will 15% of thepiston rings fall?of 0.03 centimeter. EGR 252 Fall 2018
In-Class Exercise 6.17 The average life of a certain type of small motor is 10 years with a standard deviation of 2 years. The manufacturer replaces free all motors that fail while under guarantee. If she is willing to replace only 3% of the motors that fail, how long a guarantee should be offered? Assume that the lifetime of a motor follows a normal distribution. EGR 252 Fall 2018
In-Class Exercise 6.17 The average life of a certain type of small motor is 10 years with a standard deviation of 2 years. The manufacturer replaces free all motors that fail while under guarantee. If she is willing to replace only 3% of the motors that fail, how long a guarantee should be offered? Assume that the lifetime of a motor follows a normal distribution. 3% Solve for X X = (2 * -1.88) + 10 = 6.24 A z-value of -1.88 corresponds to 3% of area under the curve EGR 252 Fall 2018