Download
1 / 17
170 likes | 237 Views
Learn to estimate population mean using t-distribution, calculate degrees of freedom, find t-values, and construct confidence intervals.

E N D
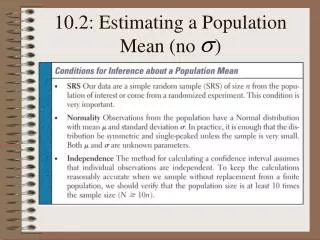
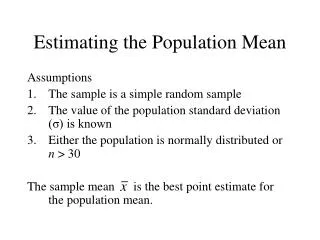
Assumptions • sample data come from a simple random sample or randomized experiment • sample size is small relative to the population size (n < 0.05N) • the data comes from a population that is normally distributed, or the sample size is large
Find the area in one tail • Find Degree of Freedom: DF = n – 1 • Look up the value in t-distribution table
1. Find the t-value such that the area in the right tail is 0.10 with 12 degrees of freedom
2. Find the t-value such that the area in the right tail is 0.05 with 20 degrees of freedom
3. Find the t-value such that the area left of the t-value is 0.01 with 9 degrees of freedom
4. Find the t-value that corresponds to 90% confidence. Assume 15 degrees of freedom
5. Determine the point estimate of the population mean and margin of error for each confidence interval Lower bound: 20, upper bound: 28
6. Confidence Interval (By Hand and By TI-83/84) A simple random sample of size 25 has a sample mean of 20.2 and a sample standard deviation of 2.1, construct a 95% confidence interval for the population mean (assume data is normally distributed)
7. Confidence Interval (By Hand and By TI-83/84) Ages of students at the college follow a normal distribution. If a sample of 15 students has an average age of 18.2 with a standard deviation of 0.5. Construct a 99% confidence interval for the population mean
8. Confidence Interval (By Hand and By TI-83/84) A sample of scores are listed below (assume the scores are normally distributed), construct a 90% interval for the population mean: 80 82 82 84 90 95 97 97
Sample Size to Estimate Population Mean E = desired margin of error = critical z score based on desired degree of confidence = previous sample standard deviation
9. Sample size If we wish to estimate the mean age of students at the college with 95% confidence within 0.2 years, how many students should we sample assuming the sample standard deviation from last year was 1.3?
10. Sample size If we wish to estimate the average hours that students watch television at 99% confidence within 1 hour, how many students should we sample assuming the sample standard deviation from last year was 2.1?