Resource Allocation & Leveling
Resource Leveling : Reschedule the noncritical tasks to smooth resource requirements Resource Allocation : Minimize project duration to meet resource availability constraints. Resource Allocation & Leveling. Three types of resources:
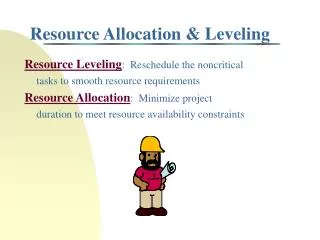

Resource Allocation & Leveling
E N D
Presentation Transcript
Resource Leveling: Reschedule the noncritical tasks to smooth resource requirements Resource Allocation: Minimize project duration to meet resource availability constraints Resource Allocation & Leveling
Three types of resources: 1) Renewable resources: “renew” themselves at the beginning of each time period (e.g., workers) 2) Non-Renewable resources: can be used at any rate but constraint on total number available 3) Doubly constrained resources: both renewable and non-renewable Resource Allocation & Leveling
3 workers 6 workers Ta Ta Ta Ta Ta sk sk sk sk sk D E C A B 1 4 3 4 5 w w w w w k ks k k k s s s START END 7 workers 5 workers 8 workers Renewable Resource Allocation Example (Single Resource Type) Maximum number of workers available = R = 9 workers
Resource Allocation Example: Early Start Schedule Maximum number of workers available = R = 9 workers
Resource Allocation Example: Late Start Schedule Maximum number of workers available = R = 9 workers
Some heuristics for assigning priorities to available tasks j, where denotes the number of units of resource k used by task j 1) FCFS: Choose first available task 2) GRU: (Greatest) resource utilization = 3) GRD: (Greatest) resource utilization x task duration = 4) ROT: (Greatest) resource utilization/task duration = 5) MTS: (Greatest) number of total successors 6) SPT: Shortest processing time = min {tj} 7) MINSLK: Minimum (total) slack 8) LFS: Minimum (total) slack per successor 9) ACTIMj: (Greatest) time from start of task j to end of project = CP - LSj 10) ACTRESj: (max) (ACTIMj) 11) GENRESj: w ACTIMj + (1-w) ACTRESj where 0 ≤ w ≤ 1 Resource Allocation Heuristics
How to schedule tasks to minimize project makespan? Priority scheme: schedule tasks using total slack (i.e., tasks with smaller total slack have higher priority)
Resource Allocation Example (cont’d) But, can we do better? Is there a better priority scheme?
Microsoft Project Solution (Resource Leveling Option) Solution by: Microsoft Project 2000
Critical Chain Project Management • Identify the critical chain: set of tasks that determine the overall duration of the project • Use deterministic CPM model with buffers to deal with uncertainty • Remove padding from activity estimates (otherwise, slack will be wasted). Estimate task durations at median. • Place project buffer after last task to protect customer’s completion schedule • Exploit constraining resource(s) • Avoid wasting slack times by encouraging early task completions • Have project team focus 100% effort on critical tasks • Work to your plan and avoid tampering • Carefully monitor and communicate buffer status
Critical Chain Buffers Project Buffer: placed after last task in project to protect schedule Feeding Buffers: placed between a noncritical task and a critical task when the noncritical task is an immediate predecessor of the critical task Resource Buffers: placed just before a critical task that uses a new resource type
Feeding Buffers Resource Buffers Critical Chain Illustrated
Resource Allocation Problem #3 Issue: When is it better to “team” two or more workers versus letting them work separately? • Have 2 workers, Bob and Barb, and 4 tasks: A, B, C, D • Bob and Barb can work as a team, or they can work separately • When should workers be assigned to tasks? Which configuration do you prefer?
Start End A C B D How to Assign Project Teams? Configuration #1 Bob and Barb work jointly on all four tasks; assume that they can complete each task in one-half the time needed if either did the tasks individually Configuration #2 Bob and Barb work independently. Bob is assigned to tasks A and C; Barb is assigned to tasks B and D
Bob and Barb: Configuration #1 Configuration #1 Bob and Barb work jointly on all four tasks. What is the expected project makespan?
Bob and Barb: Configuration #2 Bob and Barb work independently. Bob is assigned to tasks A and C; Barb is assigned to tasks B and D
Bob and Barb: Configuration #2 Bob and Barb work independently. Bob is assigned to tasks A and C; Barb is assigned to tasks B and D Expected Project Makespan: 16.42
Task B Task A START END Parallel Tasks with Random Durations • Assume that both Tasks A and B have possible durations: 8 days with probability = 0.5 10 days with probability = 0.5 • What is expected duration of project? (Is it 9 days?)
Project Monitoring and Control • “It is of the highest importance in the art of detection to be able to recognize, out of a number of acts, which are incidental and which are vital. Otherwise your energy and attention must be dissipated instead of being concentrated.” Sherlock Holmes
Status Reporting? One day my Boss asked me to submit a status report to him concerning a project I was working on. I asked him if tomorrow would be soon enough. He said, "If I wanted it tomorrow, I would have waited until tomorrow to ask for it!" New business manager, Hallmark Greeting Cards
What are appropriate performance metrics? What data should be used to estimate the value of each performance metric? How should data be collected? From which sources? At what frequency? How should data be analyzed to detect current and future deviations? How should results of the analysis be reported? To whom? How often? Control System Issues
Controlling Project Risks Key issues to control risk during projecct: (1) what is optimal review frequency, and (2) what are appropriate review acceptance levels at each stage? “Both over-managed and under-managed development processes result in lengthy design lead time and high development costs.” Ahmadi & Wang. “Managing Development Risk in Product Design Processes”, 1999
Project Control & System Variation Common cause variation: “in-control” or normal variation Special cause variation: variation caused by forces that are outside of the system According to Deming: • Treating common cause variation as if it were special cause variation is called “tampering” • Tampering always degrades the performance of a system
Project plan: We estimate that a task will take 4 weeks and require 1600 worker-hours Control System Example #1 At the end of Week 1, 420 worker-hours have been used Is the task “out of control”?
Control System Example (cont’d) Week 2: Task expenses = 460 worker-hours Is the task “out of control”?
Control System Example (cont’d) Week 3: Task expenses = 500 worker-hrs Is the task “out of control”?
Earned Value Analysis • Integrates cost, schedule, and work performed • Based on three metrics that are used as the basic building blocks: BCWS: Budgeted cost of work scheduled ACWP: Actual cost of work performed BCWP: Budgeted cost of work performed
Schedule Variance (SV) Schedule Variance (SV) = difference between value of work completedand value of scheduled work Schedule Variance (SV) = Earned Value - Planned Value = BCWP - BCWS
Cost Variance (CV) Cost Variance (CV) = difference between value of work completedand actual expenditures Cost Variance (CV) = Earned Value - Actual Cost = BCWP - ACWP
Earned Values Metrics Illustrated Planned Value (BCWS) Present time BAC Worker-Hours Actual Cost (ACWP) Cost Variance (CV) Earned Value (BCWP) Schedule Variance (SV) Week 1 Week 2 Week 3 Week 4 Week 5 Week 6
Relative Measure: Schedule Index If SI = 1, then task is on schedule If SI > 1, then task is ahead of schedule If SI < 1, then task is behind schedule
Relative Measure: Cost Index If CI = 1, then work completed equals payments (actual expenditures) If CI > 1, then work completed is ahead of payments If CI < 1, then work completed is behind payments (cost overrun)
Example #2 (cont’d) Progress report at the end of week #5: Cumulative Percent of Work Completed: Worker-Hours Charged to Project:
Example #2 (cont’d) Progress report at the end of week #5:
Using a Fixed 20/80 Rule Cumulative Percent of Work Completed:
Updating Forecasts: Pessimistic Viewpoint Assumes that rate of cost overrun will continue for life of project…. = (64/52.2) 128 = 1.23 x 128 = 156.94 worker-hrs
Updating Forecasts: Optimistic Viewpoint Assumes that cost overrun experienced to date will cease and no further cost overruns will be experienced for remainder of project life…
Multi-tasking with Multiple Projects How to prioritize your work when you have multiple projects and goals? Consider two projects with and without multi-tasking Project A Project B A-1 B-1 A-2 B-2 A-3 B-3 A-4 B-4
Due-Date Assignment with Dynamic Multiple Projects • Projects arrive dynamically (common situation for both manufacturing and service organizations) • How to set completion (promise) date for new projects? • Firms may have complete control over due-dates or only partial control (i.e., some due dates are set by external sources) • How to allocate resources among competing projects and tasks (so that due dates can be realized)? • What are appropriate metrics for evaluating various rules?
What Does the Research Tell Us? • Study by Dumond and Mabert* investigated four due date assignment rules and five scheduling heuristics • Simulated 250 projects that randomly arrive over 2000 days • average interarrival time = 8 days • 6 - 49 tasks per project (average = 24); 1 - 3 resource types • average critical path = 31.4 days (range from 8 to 78 days) • Performance criteria: 1) mean completion time 2) mean project lateness 3) standard deviation of lateness 4) total tardiness of all projects • Partial and complete control on setting due dates * Dumond, J. and V. Mabert. “Evaluating Project Scheduling and Due Date Assignment Procedures: An Experimental Analysis” Management Science, Vol 34, No 1 (1988), pp 101-118.