Download
1 / 9
110 likes | 213 Views
This analysis focuses on utilizing Analysis of Variance to test the equality of population means of days absent across different job types. Assumptions and multiple comparisons are conducted to determine significant differences and confidence levels among the job types.

E N D
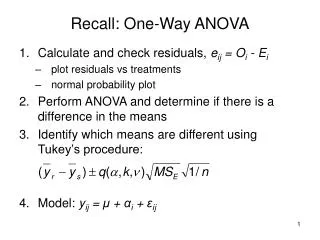
One-way ANOVA • Example • Analysis of Variance Hypotheses • Model & Assumptions • Analysis of Variance • Multiple Comparisons • Checking Assumptions
Analysis of Variance • Analysis of Variance is a widely used statistical technique that partitions the total variability in our data into components of variability that are used to test hypotheses about equality of population means. • In One-way ANOVA, we wish to test the hypothesis: H0: 1= 2= = k against: Ha:Not all population means are the same
Assumptions • Each population being sampled is normally distributed and all populations are equally variable. • Normality can be checked by skewness/kurtosis or normal probability plots. If any of the samples do not look like they come from a normal population the assumption is not met (unless the samples that do not look normal have a large sample size (n>30) • Equal variability can be checked by comparing standard deviations. If no standard deviation is more than 2 times bigger than another equal variability can be assumed.
Example: Are the population mean days absent the same for all 4 job types? H0: μA = μB = μC = μD H1: Not all μ’s are equal We can be almost 100% confident that population mean days absent differ in some way between the 4 job types.
( ) æ ö - k k ! k k 1 ç ÷ = = ç ÷ - 2 2 ! ( k 2 )! 2 è ø Multiple Comparisons • A significant F-test tells us that at least two of the underlying population means are different, but it does not tell us which ones differ from the others. • We need extra tests to compare all the means, which we call Multiple Comparisons. • We look at the difference between every pair of group population means, as well as the p-value for each difference. • When we have k groups, there are: possible pair-wise comparisons. For example 4 groups have 4*3/2 = 6 comparisons.
Multiple Comparisons • If we estimate each comparison separately with 95% confidence, the overall confidence will be less than 95%. • So, using ordinary pair-wise comparisons (i.e. lots of individualt-tests), we tend to find too many significant differences between our sample means. • We need to modify our p-values so that we determine the true differences with 95% confidence across the entire set of comparisons. • These methods are known as: multiple comparison procedures
Multiple Comparisons • We use Tukey simultaneous comparisons. • Tukey simultaneous comparisons overcome the problems of the unadjusted pair-wise comparisons finding too many significant differences (i.e. p-values that are too small).
Tukey Pair-wise Comparisons We can be at least 99% confident that Job Type A has the highest population mean days absent. We can be also more than 99% confident that C and D have a larger population mean days absent than B. We can only be 95% confident that Job Type C has a higher population mean than D.