Observational Data Analysis to Support PM2.5 SIP Development
750 likes | 953 Views
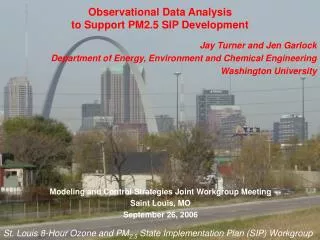
Observational Data Analysis to Support PM2.5 SIP Development. Jay Turner and Jen Garlock Department of Energy, Environment and Chemical Engineering Washington University. Modeling and Control Strategies Joint Workgroup Meeting Saint Louis, MO September 26, 2006.

Observational Data Analysis to Support PM2.5 SIP Development
E N D
Presentation Transcript
Observational Data Analysis to Support PM2.5 SIP Development Jay Turner and Jen Garlock Department of Energy, Environment and Chemical Engineering Washington University Modeling and Control Strategies Joint Workgroup Meeting Saint Louis, MO September 26, 2006 St. Louis 8-Hour Ozone and PM2.5 State Implementation Plan (SIP) Workgroup
Motivation & Objectives • St. Louis – Midwest Supersite program has collected a wealth of data for fine particle physical and chemical properties • Together with the state/local routine monitoring data, there is substantial information to support in PM2.5 SIP planning for the St. Louis area • Data analysis is needed to complement chemical transport modeling (CTM) • CTM model validation and diagnostics • Weight of evidence approach to control strategy development
BRIEF Summary of the St. Louis Supersite • Four year campaign, core monitoring site in East St. Louis, IL • Two years of intensive measurements (5/2001 – 5/2003) • Two years of measurements with a subset of the initial monitoring platform (6/2003 – 3/2005) • Data collection and analysis to support: • Development and evaluation of monitoring methods • e.g. “Development of a Wet Chemical Method for the Speciation of Iron in Atmospheric Aerosols", B.J. Majestic et al. (2006) Environmental Science & Technology • Exposure and health effects studies • e.g. "Association of ventricular arrhythmias detected by implantable cardioverter defibrillator and ambient air pollutants in the St Louis, Missouri metropolitan area", D.Q. Rich et al. (2006) Occupational and Environmental Medicine • Source apportionment and SIP planning • e.g. "Source Identification of Airborne PM-2.5 at the St. Louis - Midwest Supersite", J.H. Lee et al. (2006) Journal of Geophysical Research - Atmospheres
SIP Planning Support Grant to WUSTL • Coordination • Organic Carbon Source Apportionment • Data Harmonization & Episodes Analysis • Urban / Rural Contrast & Intraurban Variability • Transport Regimes Analysis • Refinements to PM2.5 Mass Apportionment • Soil / Road Dust Characterization Subcontractors: • University of Wisconsin (Schauer group) • Sonoma Technology, Inc. Performance period August 1, 2006 through July 31, 2007 (however, effort must be substantially front-loaded)
SIP Planning Support Grant to WUSTL • Coordination • Organic Carbon Source Apportionment • Data Harmonization & Episodes Analysis • Urban / Rural Contrast & Intraurban Variability • Transport Regimes Analysis • Refinements to PM2.5 Mass Apportionment • Soil / Road Dust Characterization Subcontractors: • University of Wisconsin (Schauer group) • Sonoma Technology, Inc. Performance period August 1, 2006 through July 31, 2007 (however, effort must be substantially front-loaded)
Data Harmonization & Episodes Analysis • Develop a “harmonized” data set for East St. Louis for 2002 to be used in chemical transport model validation • Reconcile inconsistencies in the data streams • Integrated sampling versus continuous monitoring • Multiple methods to measure the same parameter • Develop a conceptual model for fine particulate matter in STL • Emphasis on factors affecting PM2.5 mass • Start by examining two-to-three episodes in detail • Sulfate episode: August 27 – September 10, 2002 • Nitrate episode: December 3 – December 17, 2002 • Carbon episode (?) • Significant collaboration between the data analysis and modeling teams • PSAT analysis by Morris group (Environ) • Modeling by Kleeman group (UC-Davis)
Example – December 2002 Nitrate Episode • Speciation network filter 24-hour integrated filter nitrate
Example – December 2002 Nitrate Episode • STL Supersite daily 24-hour filter nitrate
Example – December 2002 Nitrate Episode • STL Supersite hourly nitrate (Particle-into-Liquid Sampler)
Example – December 2002 Nitrate Episode • STL Supersite hourly nitrate (Particle-into-Liquid Sampler) • frequent midday decreases, not captured by filter data
Example – August/September 2002 Sulfate Episode • 24-hour integrated sulfate (red) and hourly sulfate, East St. Louis
Example – August/September 2002 Sulfate Episode • Continuous sulfate measurements also conducted in Reserve, KS during this time period!
Semicontinuous Sulfate - Data Quality • 24-hour average semicontinuous sulfate versus 24-hour integrated filter sulfate East St. Louis, IL August 2002 through January 2003
Conceptual Model for Urban Area Fine PM Mass point sources within urban area diffuse sources within urban area precursors converted to PM over the urban area regionally transported material (primarily sulfate, nitrate and carbon)
Intraurban Variability in Fine PM • Factors Contributing to Spatial Variability in PM2.5 Concentrations within Urban Areas*: • local sources of primary PM (or fast-reacting precursors) • topographic barriers separating sites • transient emissions events • meteorological phenomena • differences in the behavior of semi-volatile components • measurement error • Data from multiple monitors within the urban area can be used to infer intraurban spatial variability in urban PM burdens • Must interpret data in light of differences in monitor makes and models (e.g. TEOM vs BAM vs SHARP) *Pinto, J.P., Lefohn, AS., Shadwick, D.S. Journal of Air and Waste Management Association, 54,440-449, 2004
STL Source Apportionment Studies • Receptor modeling – explain observational data collected at a monitoring site (receptor) • linear combinations of source contributions that can “best” explain the observations
STL Source Apportionment Studies • Receptor modeling – explain observational data collected at a monitoring site (receptor) • linear combinations of source contributions that can “best” explain the observations • Chemical Mass Balance (CMB) • all significant sources identified and their emission profiles (fingerprints) are known (does not require emission rates)
STL Source Apportionment Studies • Receptor modeling – explain observational data collected at a monitoring site (receptor) • linear combinations of source contributions that can “best” explain the observations • Chemical Mass Balance (CMB) • all significant sources identified and their emission profiles (fingerprints) are known (does not require emission rates) • Receptor Modeling (e.g. PMF) • Examine covariance in large observational data sets • Reduction in variables to yield a set of “factors” which can explain most of the variance in the data • Hopefully these factors represent discernible source categories (factor loadings similar to fingerprints or have other distinguishing features) • Confirm using meteorology data, in some case pinpoint specific sources • Factors can be admixtures of contributions from multiple sources… no constraints by the actual emission fingerprints
STL Fine PM Mass Apportionment Studies * Version of PMF to be determined ** Sensitivity studies and refinements to the apportionment of Lee, Hopke and Turner (2006) Acknowledgement: Mike Davis (EPA Region VII) for draft synthesis of the contemporary STL PM2.5 mass apportionment studies
Reconciling the Hopke Group (Clarkson) Apportionments Different data collection and analysis methods (especially carbon); consistent source apportionment methodology NR NR NR NR NR (*) Soil: Arnold includes separate Ca-rich factor; Blair = soil + non-soil industrial (**) Nonferrous Metals: Arnold includes steel processing NR = factor not resolved
Sulfate Factor Sulfate factor... Is this gradient from sulfate ion concentration, or from other species present in the sulfate factor? NR NR NR NR NR (*) Soil: Arnold includes separate Ca-rich factor; Blair = soil + non-soil industrial (**) Nonferrous Metals: Arnold includes steel processing NR = factor not resolved
Nitrate Factor Nitrate factor... Is this gradient from nitrate ion concentration, or from other species present in the nitrate factor? NR NR NR NR NR (*) Soil: Arnold includes separate Ca-rich factor; Blair = soil + non-soil industrial (**) Nonferrous Metals: Arnold includes steel processing NR = factor not resolved
Mobile Source Factor Mobile source factor… gradient seems backwards; highest in suburbs and lowest in urban core. NR NR NR NR NR (*) Soil: Arnold includes separate Ca-rich factor; Blair = soil + non-soil industrial (**) Nonferrous Metals: Arnold includes steel processing NR = factor not resolved
Soil / Crustal Material Factor Soil/crustal factor… difficult to assess consistency due to admixing with other sources (see footnote) ? NR NR NR NR NR (*) Soil: Arnold includes separate Ca-rich factor; Blair = soil + non-soil industrial (**) Nonferrous Metals: Arnold includes steel processing NR = factor not resolved
Steelmaking Factor Steel production… relatively large at East St. Louis but small at Blair; not resolved at Arnold NR NR NR NR NR (*) Soil: Arnold includes separate Ca-rich factor; Blair = soil + non-soil industrial (**) Nonferrous Metals: Arnold includes steel processing NR = factor not resolved
Nonferrous Metals Processing Factor Nonferrous metals (zinc, lead, copper)… in aggregate similar contributions across al three sites NR NR NR NR NR (*) Soil: Arnold includes separate Ca-rich factor; Blair = soil + non-soil industrial (**) Nonferrous Metals: Arnold includes steel processing NR = factor not resolved
Biomass Burning Factor Biomass burning… not resolved at Blair, not resolved in published East St. Louis apportionment but subsequent work by Hopke group suggests it can be resolved NR NR NR NR NR (*) Soil: Arnold includes separate Ca-rich factor; Blair = soil + non-soil industrial (**) Nonferrous Metals: Arnold includes steel processing NR = factor not resolved
“Carbon-Rich Sulfate” Factor Carbon-rich sulfate factor… 20% of mass at East St. Louis… what does it represent? NR NR NR NR NR (*) Soil: Arnold includes separate Ca-rich factor; Blair = soil + non-soil industrial (**) Nonferrous Metals: Arnold includes steel processing NR = factor not resolved
Representations of Carbonaceous Material • Total Carbon (TC)
Representations of Carbonaceous Material • Total Carbon (TC) • Two fractions • Organic carbon (OC) • Elemental carbon (EC) OC EC
Representations of Carbonaceous Material • Total Carbon (TC) • Two fractions • Organic carbon (OC) • Elemental carbon (EC) • Eight fractions • Five OC fractions • Three EC fractions OC EC
Representations of Carbonaceous Material • Total Carbon (TC) • Two fractions • Organic carbon (OC) • Elemental carbon (EC) • Eight fractions • Five OC fractions • Three EC fractions • Speciated Organics • Number of compounds depends on method individual OC compounds … unresolved OC EC
Carbon in the Hopke Apportionments Arnold Blair East St. Louis NIOSH OC/EC IMPROVE carbon fractions
Apportionments with NIOSH OC/EC at all Sites Carbon-rich sulfate factor primarily distributed to sulfate and nitrate… largely regionally transported carbon? NR NR NR NR NR NR (*) Soil: Arnold includes separate Ca-rich factor; Blair = soil + non-soil industrial (**) Nonferrous Metals: Arnold includes steel processing NR = factor not resolved
Apportionments with NIOSH OC/EC at all Sites Intraurban gradients still exist! Regional plus local contributions and/or measurement artifacts? NR NR NR NR NR NR (*) Soil: Arnold includes separate Ca-rich factor; Blair = soil + non-soil industrial (**) Nonferrous Metals: Arnold includes steel processing NR = factor not resolved
Intraurban Variability - Sulfate • Sulfate at Arnold, East St. Louis, and Blair (City of St. Louis) during the St. Louis Supersite daily measurements period (include only days with a valid measurement at all three sites) maximum difference is 4% (ESL vs. Blair) N = 213
East St. Louis Sulfate • Examine day of week patterns for evidence of local contributions to observed sulfate. • Day of week analysis for possibly not robust using 1-in-3 day (e.g. STN) data because there is strong seasonality and, within a season, episodic behavior STL Supersite, East St. Louis Daily 24-hour integrated fine PM sulfate by the Harvard-EPA Annular Denuder System (HEADS) April 2001 – May 2003
East St. Louis Sulfate – Day of Week • Represent a given day’s sulfate by the ratio of its concentration to the weekly average, centered on that day (following Millstein, Harley and Hering, IAC Meeting, September 2006, nitrate analysis) • median = black line • mean = red line • circles = 5th / 95th percentiles No discernible day of week trends (as expected) sulfate concentration essentially all regional, sulfate factor varies due to carbon loadings on this factor
Monitoring Locations: 8/17/01 – 11/20/01 St. Louis Supersite core site, East St. Louis, IL URBAN St. Louis Supersite satellite site, Park Hills, MO RURAL East St. Louis (IL) is approximately 3 km east of the City of St. Louis (MO) central business district. Park Hills (MO) is a predominantly rural site ~100 km south/southwest of the St. Louis urban core.
Daily-Integrated PM2.5 Sulfate September 5-6 As expected, fine particulate matter sulfate is highly coupled between the two sites.
Daily-Integrated PM-2.5 Sulfate September 5 Park Hills, MO (rural) - PH versus East St. Louis, IL (urban) - ESL 8/17/2001 – 11/20/2001 N = 90 Avg ESL = 3.27 mg/m3 Avg PH = 3.13 mg/m3 ESL / PH (urban/rural)… - Ratio of Site Avg = 1.04 - Avg of Daily Ratio = 1.13 - Geo Mean of Daily Ratio = 1.05 September 6 Two days – representing the highest sulfate concentration at each respective site – appear to be outliers. These samples are actually adjacent days…
Using Semicontinuous Data at the Urban Site to Reconcile the Apparent Sulfate Outliers A short-duration (~24 hr) sulfate event passed through the St. Louis on the evening of 9/5 and morning of 9/6. Surface wind data and air mass back trajectories suggest this air mass passed through the rural site about ½ day earlier and thus was largely contained within the 9/5 sample 24-hour sulfate event – very different compared to the aforementioned characteristic multiday pattern! … an example where the use of daily 24-hour integrated samples might be misleading.
Intraurban Variability - Nitrate • Nitrate at Arnold, East St. Louis, and Blair (City of St. Louis) during the St. Louis Supersite daily measurements period (include only days with a valid measurement at all three sites) +12% +22% +10% N = 206
East St. Louis Nitrate • Examine day of week patterns for evidence of local contributions to observed nitrate. • Again, methodology must account for seasonal and episodic variations which can confound day-of-week analyses STL Supersite, East St. Louis Daily 24-hour integrated fine PM nitrate by the Harvard-EPA Annular Denuder System (HEADS) April 2001 – May 2003
East St. Louis Nitrate – Day of Week • Represent a given day’s nitrate by the ratio of its concentration to the weekly average, centered on that day (following Millstein, Harley and Hering, IAC Meeting, September 2006) • median = black line • mean = red line • circles = 5th / 95th percentiles Nitrate lowest on Mondays, followed by Sundays and Tuesdays Modulation of nitrate by weekend/weekday differences in local emissions
PM2.5 Mass Apportionment Status • Sensitivity and related studies are underway for East St. Louis apportionment • Repeat modeling for all sites • Consistent modeling methodology (EPA PMF) • NIOSH OC/EC data for East St. Louis to be consistent with STN sites • Use all available data for the modeling but report out annual-average (not study-average) contributions • Model each site individually, and combine all sites into a single model
Refinements to PM2.5 Mass Apportionment (6) • Refined interpretation of existing apportionments and also refined apportionments; certain aspects already discussed • Example of refined interpretation of an existing apportionment • Carbon-rich sulfate (CRS) factor in the East St. Louis apportionment by Lee, Hopke & Turner (2006) • ~20% of the PM2.5 mass observed at East St. Louis • Relatively high EC/OC ratio in the factor profile suggests unaged, and therefore likely local, carbon • Compare total carbon apportionments for • IMPROVE carbon fractions • IMPROVE OC/EC • NIOSH OC/EC
Total Carbon Distribution Across Factors- three methods for representing carbon - Carbon fractions: TC(CRS, nitrate, sulfate) = 1.8 mg/m3 IMPROVE OC/EC: TC(nitrate, sulfate) = 1.5 mg/m3 NIOSH OC/EC: TC(nitrate, sulfate) = 1.5 mg/m3 CRS LIKELY REGIONAL!
Interpretation of Carbon-Rich Sulfate Factor • Factor profile predominantly carbon, some sulfate • Relatively high EC/OC ratio suggests unaged carbon and thus likely local sources • However, modeled apportionments using different representations for carbon suggests the factor represents regional sources • Reconcile East St. Louis TC apportionment with urban/rural contrast, August-November 2001 measurements (Park Hills) • Assume TC at Park Hills is the regional contribution • Add in the modeled TC apportioned to STL local sources (all factors except sulfate, nitrate) • Can we reconstruct the observed TC at East St. Louis? • Two scenarios, carbon-rich sulfate as a local contribution or as a regional contribution
Carbon-Rich Sulfate Factor as Regional Source • Despite the relatively high EC/OC ratio in the CRS factor, treat as regional rather than local source… good reconstruction!