Download
1 / 47
470 likes | 802 Views
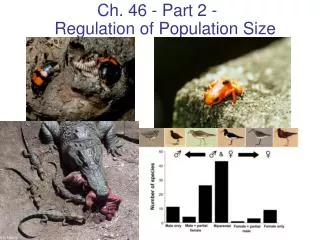
Ch. 46 - Part 2 - Regulation of Population Size. Regulation of Population Size. The study of population dynamics Focuses on the complex interactions between biotic and abiotic factors that cause variation in population size. Population Change & Population Density.

E N D
Regulation of Population Size • The study of population dynamics • Focuses on the complex interactions between biotic and abiotic factors that cause variation in population size
Population Change & Population Density • In density-independent populations • Birth rate and death rate do not change with population density • In density-dependent populations • Birth rates fall and death rates rise with population density
Density-independent factors • Population limiting factors whose occurrence is not affected by population density • Abiotic factors such as climate and weather, fire, physical disruption of habitat • Limit population size well before resources or other density-dependent factors become important • Can cause rapid crashes in populations
Density-independent Effect Impact of flash flood not affected by density: 3/5 die in low-density area = 60% 12/20 die in high-density area = 60%
Density-dependent factors • Population limiting factors whose effects depend on population density • As the number of individuals increases, so does the percentage of individuals affected • Generally are biotic factors like: -Competition - Predation - Parasitism
Competition: • Intraspecific competition is competition between members of the same species for resources that are limited in supply (food, shelter, mates) - Populations usually compete for resources unless population is held below carrying capacity by other factors • Interspecific competition is competition between members of different species
Density-dependent Effects - Competition When density is low (a) every bird has access to nesting hole When density is high (b) there is competition & not all birds gain a nest hole
4.0 10,000 3.8 3.6 1,000 Average number of seeds per reproducing individual (log scale) 3.4 Average clutch size 3.2 3.0 100 2.8 0 0 20 30 40 50 60 80 10 70 0 10 100 Seeds planted per m2 Density of females (a) Plantain. The number of seeds produced by plantain (Plantago major) decreases as density increases. (b) Song sparrow. Clutch size in the song sparrow on Mandarte Island, British Columbia, decreases as density increases and food is in short supply. Competition for Resources • In crowded populations, increasing population density intensifies intraspecific competition for resources
Density-dependent Effect on Reindeer Individuals in a large population have a smaller share of the limited food supply. Reindeer on St. Paul Island, Alaska underwent a sharp decline as a result of overgrazing of the land
Figure 52.16 Territoriality • In many vertebrates and some invertebrates • Territoriality may limit density • Cheetahs mark their territories with chemicals
Figure 52.17 • Oceanic birds • Exhibit territoriality in nesting behavior
Health • Population density can influence the health and survival of organisms • In dense populations pathogens and disease can spread more rapidly Predation • As a prey population builds up predators may feed preferentially on that species • The major limiting factor for predator populations is the availability of its prey • Predation is probably a significant factor for the prey population
Density-dependent Effects - Predation Easier to find prey at high densities Harder to find prey at low densities
Most populations are probably regulated by a mixture of density-independent and density dependent factors • Many populations are fairly stable and near carrying capacity that and are regulated by density-dependent factors • Many others show short-term fluctuations due to density-independent factors
Life History Patterns Populations vary on factors such as: • number of births per reproduction • age of reproduction • life span of individuals • probability of living entire life span • These factors are part of a species life history. - There are trade-offs to be made regarding how much energy to use for which purposes • Natural selection shapes the life histories of species
Two Types of Life History Patterns: • K-selection, or density-dependent selection • Selects for life history traits that aresensitive to population density • r-selection, or density-independent selection • Selects for life history traits that maximize reproduction
Opportunistic life history (r-strategists) • Small bodied species, reproduce when young, produce many offspring, populations tend to grow exponentially when conditions are favorable • Such populations typically live in unpredictable environments and are controlled by density-independent factors • Emphasis on quantity of reproduction rather than on individual survivorship or quality • Exhibit type III survivorship curves • Use a tactic calledr-selection • Examples: bacteria, insects, rodents, annual plants
Equilibrium life history (K-strategists) • Larger bodied species, produce few slowly maturing offspring but provide care for their young • Population size stable, near carrying capacity, held there by density-dependent factors • Natural selection resulted in production of better-adapted offspring • Exhibit type I survivorship curve • Use tactic called K-selection • Examples: Saguaro cacti, oaks, pines, birds of prey, large mammals, humans
Human Population Growth • Human population has gone through a period of rapid exponential growth • Went around “the bend” of the J-shaped curve around 1650. - It had taken millions of years to reach that point. • Once around the bend, the time it takes to double the population (doubling time) shrinks rapidly. Now about 53 years. • No population can grow indefinitely • And humans are no exception
6 5 4 Human population (billions) 3 2 The Plague 1 0 0 8000 B.C. 4000 B.C. 3000 B.C. 2000 B.C. 1000 B.C. 1000 A.D. 2000 A.D. Figure 52.22 The Global Human Population
2.2 2 1.8 1.6 2003 1.4 Percent increase 1.2 1 0.8 0.6 0.4 0.2 0 1950 2025 2050 1975 2000 Year Figure 52.23 Though the global population is still growing • The rate of growth began to slow approximately 40 years ago
Country Development: • More-Developed Countries (MDCs) • Slow population growth (0.1% overall) (0.6% in United States due to high immigration levels) • High standard of living • North America, Europe,Japan, Australia • Doubled populations between 1850 & 1950. Due to: 1.Decline in death rate due to modern medicine & improved socioeconomic conditions. 2. Decline in birthrates shortly thereafter. This is sequence of events is called the demographic transition.
Country Development; • Less-Developed Countries (LDCs) • Rapid population growth; current rate is 1.6% • Low standard of living • Latin America, Africa and Asia • Continuing increases in population due to: 1. Steep decline in death rate after WWII due to importation of modern medicine 2. Demographic transition occurred later - 82% of world’s population lives in Africa, Asia & Latin America
60 80 50 60 40 Infant mortality (deaths per 1,000 births) Life expectancy (years) 40 30 20 20 10 0 0 Developed countries Developed countries Developing countries Developing countries Figure 52.26 Infant Mortality and Life Expectancy • Infant mortality and life expectancy at birth • Vary widely among developed and developing countries but do not capture the wide range of the human condition
Age Distributions • A country’s age structure can be used to predict future population growth. • LDC’s have larger population growth because they have more women entering the reproductive years than older women leaving them. • Zero Population Growth: If each couple has two children to replace themselves, eventually the human population will level off but NOT immediately. Why? • Replacement Reproduction: The greater number of women entering their reproductive years compared to older women leaving them, will cause most countries to continue to grow for at least one or two generations.
Decrease Italy Slow growth United States Rapid growth Afghanistan Male Female Female Male Male Age Age Female 85 85 80–84 80–84 75–79 75–79 70–74 70–74 65–69 65–69 60–64 60–64 55–59 55–59 50–54 50–54 45–49 45–49 40–44 40–44 35–39 35–39 30–34 30–34 25–29 25–29 20–24 20–24 15–19 15–19 10–14 10–14 5–9 5–9 0–4 0–4 8 8 8 6 6 6 4 4 4 2 2 2 0 0 0 2 2 2 4 4 4 6 6 6 8 8 8 Percent of population Percent of population Percent of population Figure 52.25 Age Structure Pyramids
Environmental Impact • Environmental impact of a population is measured in terms of: 1. Population size 2. Resource consumption per capita 3. Resultant pollution caused by population size and increased resource consumption Thus, there are two types of overpopulation: • Due to population growth (obvious in LDCs) • Due to resource consumption (obvious in MDCs) Average person in US = 30 in India
Population growth is putting extreme pressure on each country’s social organization, the Earth’s resources, and the biosphere • MDCs consume a much larger proportion of the Earth’s resources than do LDCs
U.S.Population Statistics • 281,000,000 (April 2000); • 309,000,000 (March 2010) • Most people are Caucasian (66%) • Hispanic (15%) - 60% from Mexico • Black (12%) • Asian (4%) - ~36% live in CA • Mixed (2%) • Native Americans (1%) • 40% of population under 18 belong to a minority group - minorities increasing
Average Density of People in U.S. & Diamond Bar, CA • U.S. Density = 73 people/mi2 • Diamond Bar area = 14.9 mi2 or 38.8 km2 • Population = 58,763 people • D.B. Density = 3,944 people/mi2 or 1,515 people/km2
Mumbai, India - World’s Most Densely Populated City • 14.35 million people/484 km2 • Density Mumbai = 29,650 people/km2 • Let’s get the Diamond Bar equivalent: 29,650 people/km2 (density-Mumbai) X 38.8 km2 (D.B.) would be 1,150,420 people in DB • Others: • Shenzhen, China (5th) - 466 km2 / 8 million people (17,150 people/km2) • Seoul, South Korea - 16,700 people/km2 • Taipei, Taiwan - 15,200 people/km2