Download
1 / 17
180 likes | 218 Views
Discover the importance of proton transfer in enzyme activity and bioenergetics, from localized events to long-distance translocation in membranes. Explore proton transfer in proteins and specialized channels, shedding light on key factors affecting conduction rates. Uncover the mechanisms behind kinetic barriers and electrostatic penalties in proton transport.

E N D
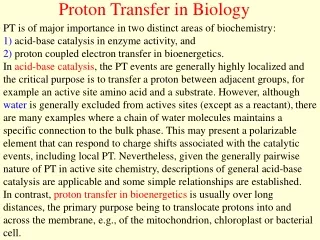
Proton Transfer in Biology PT is of major importance in two distinct areas of biochemistry: 1)acid-base catalysis inenzyme activity, and 2)proton coupled electron transfer in bioenergetics. In acid-base catalysis, thePT events are generally highly localized and the critical purpose is to transfer a protonbetween adjacent groups, for example an active site amino acid and a substrate.However, although water is generally excluded from actives sites (except as a reactant),there are many examples where a chain of water molecules maintains a specificconnection to the bulk phase. This may present a polarizable element that can respondto charge shifts associated with the catalytic events, including local PT. Nevertheless,given the generally pairwise nature of PT in active site chemistry, descriptions of generalacid-base catalysis are applicable and some simple relationships are established. Incontrast, proton transfer in bioenergetics is usually over long distances, the primarypurpose being to translocate protons into and across the membrane, e.g., of themitochondrion, chloroplast or bacterial cell.
Proton Transfer in Proteins Proton migration inwateroccurs through ahydrogen bonded chain or network. However, even inwater the result is not a long distance concerted transfer over multiple oxygen centers.The excess mobility of the proton arises simply from the increased step size of therandom walk, i.e., diffusion, as the proton charge is moved across the diameter of a singlewater molecule (≈2.5 Å) in about 1 ps, the Debye (rotational) relaxation time of water. In a low dielectric environment like a protein interior, transfer of the protonic charge acrosshydrogen bonds undoubtedly occurs, and may be responsible for the excess diffusion ofprotons (like in bulk water), additional factorsintrude, including 1)an electrostatic (Born) energy barrier to entry, as well as 2)sitedifferences,which can easily dominate the structural aspects of the conduction (i.e., theGrotthuss mechanism) once inside. The protein structure could be designed tominimize the Born energy factor, as seen in the specialized channel proteins for K+ andCl- conduction, but such a system has not yet been described for protons.
PT through the gramicidin A (gA) channel The gramicidin A, an ionophorous antibiotic may come as close as we know to aproton conducting, hydrogen bonded chain with a low Born energy factor. The experimental activation energy for H+ conduction in gAisquite small in good agreement with calculated proton energies relative to thebulk phase (5-7 kcal/mole, Warshel). The proton’s exit from the channel seems the rate limiting step, which suggests that the channel, possibly including the induced polarization of the water file, “holds on” to the proton as it tries to leave. NMR studies have provided structural information on theconduction of alkali metal cations through the gA channel, which may also be relevant tounderstanding proton conduction.Entry to the channel is accompanied by thesequential removal of waters of hydration from the cation in three distinct steps as the ionmoves from one site to the next. Ultimately, the ion is associated with only 2 waters –one ahead and one behind in the single file of the channel. In this same entrance (andexit) region of the channel, the ion has a significant electrostatic interaction with the 4tryptophans (approx 1 kBT per indole) that comprise a well-defined collar in themembrane headgroup region of the channel.Conceivably, this provides theinteraction that limits proton exit from gA.
Aquaporin The aquaporin is a membrane proteindesigned to conduct water but not protons. Here, the water chain that spans the channelreverses the polarity of the hydrogen bonded water dipoles at the mid-point of themembrane span and this structural feature was suggested to impede proton transportby interrupting the conduction pathway. However, subsequent calculations andmolecular dynamics simulations have shown that a significant contribution to the barrierfor proton conduction comes from the electrostatics and related desolvation penalty for aprotonic charge to penetrate into the channel interior. The relative magnitudes ofthese contributions are, of course, under intense debate! Conclusions: the kinetic barriers to protontransfer are small and conduction rates can be controlled by electrostatic penalties topopulating internal sites, or be facilitated by a flat profile. We need to know 1) how to probe the mechanism by, for example, changing theproton donors and acceptors or otherwise changing the driving force for PT, and 2) how toanalyze the experimental results. These questions are not yet settled.
Carbonicanhydrase Proton transferfrom active site of carbonic anhydrase: a proton is take up (or released) as part of the stoichiometricturnover: CO2 + H2O ‹—› HCO3- + H+ Somewhat surprisingly, the transport of H+ in and out of the active site is the rate limitingstep. PT occurs over a distance of 8-10 Å and isassociated with the regeneration ofthe active site Zn2+-OH- complex: Zn2+-OH2 + B ‹—› Zn2+-OH- + BH+ The communication between the zinc-bound water and the aqueous phase is mediated bya short chain of 2-3 water molecules and an amino acid side chain, represented by B/BH+,which is in contact with the bulk phase. In carbonic anhydrase II, the fastest of the manymammalian isozymes, B/BH+ is a histidine (His64, see the structure).
The active site of carbonic anhydrase II. The reactivewater/hydroxyl is bound to azinc(II) ion (black), which is liganded by three histidines. The fourth histidine,His64, is at the entrance of the active site cleft and is observed in two distinctconfigurations – the “out” position is essentially in the bulk phase. Up to fouradditional water molecules are seen in different crystal structures, as shown,bridging the zinc-bound water and His64 in the“in” position.
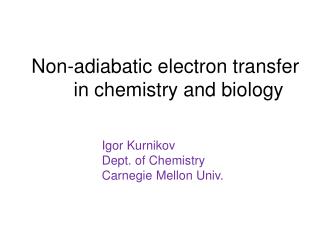
Free Energy Relationships – Marcus and Brönsted Correlations between reaction rates and free energy changes (or equilibrium constants) are often observed in chemistry, and significance for these free energy relationships (FERs) has long been sought. In general, it is obscure except at a qualitative level, but the simplicity of electron transfer (ET) has allowed genuinely theoretical descriptions to be developed.These are commonly referred to as Marcus theory, although many names are associatedwith current formulations of it. The essential ingredients of Marcus theory are that thereaction coordinate for ET is controlled by the nuclear reorganization of the environment(solvent polarization), and that the donor and acceptor are weakly interacting, so that theET is non-adiabatic. From the Golden Rule of perturbation theory, the probability of transition between initial and final states is: Vifrepresents the electronic coupling or matrix element that mixes the initial and final states – or, in molecular terms, the strength of interaction between the electron donor andacceptor. ρfis the density of states that are accessible to the transition from i –› f whilemaintaining conservation of energy. It is commonly called the Franck-Condon factor, orthermally weighted density of states, and is the ratio of states at the transition staterelative to the reactant ground state. For a thermal reaction it provides the activationenergy term.
For a non-adiabatic transition, the Franck-Condon factor defines the intersection of the diabatic curves for initial and final states, and, when these are represented as harmonic oscillators, it can be easily derived and calculated. This is the familiar, classical form of Marcus theory. where the activation free energy, ∆G* = (λ + ∆G0)2/4 λ = λ/4(1 + ∆G0/ λ)2, is given as theintersection point of two parabolas representing the diabatic curves of the reactant andproduct states (see next Figure). The novel concept, here, is the reorganization energy, λ, whichis the energy gap between the reactant state at its vibrational equilibrium position and apoint on the reactant curve that is vertically above the product state equilibrium. It is theequivalent, in energy units, of the difference between the equilibrium positions ofreactant and product along the vibrational coordinate. The reorganization energydescribes the responsiveness of the vibrational system (including solvent) to theelectronic changes in the reaction. Together with the free energy of the reaction, ∆G0, itquantifies the energy necessary to generate an intermediate nuclear configuration that hasthe same total energy before and after electron transfer.
Marcus theory diagram for electron transfer, showing weak electronic coupling Vif.A single reactant surface (black) and four possible product surfaces arerepresented as parabolas. The reorganization energy, λ, is given by the position onthe reactant curve that lies above the equilibrium coordinate of the product curves.The product surfaces are shown for several net driving forces (∆G0 values). For∆G0 = 0 (black), the intersection between reactant and product curves is at λ/4, indicating the activation free energy for the thermodynamically neutral reaction(∆G0*, the “intrinsic” barrier). As the free energy decreases from unfavorable(pink) tofavorable, the activation free energy decreases and the reactionaccelerates. ∆G* is zero and the rate is maximum when ∆G0 = - λ (red). At verylarge (negative) driving forces (∆G0 < - λ) (blue), Marcus theory predicts an“inverted region” where the activation free energy increases again and the rate ofreaction slows. At each intersection point the reactant (initial) and product (final)states interact weakly to yield two curves separated by 2Vif (shown for the blackcurves), where Vif is the coupling or interaction energy. For non-adiabatic electrontransfer, the splitting is very small, yielding what is called an “avoided crossing”.In solution, the formation of the reaction complex (to which Marcus theory may beapplied) and dissociation of the products involve work terms, wr and wp, whichraise the reactant and product curves – often by similar amounts.
The reorganization energy is determined both by the magnitude of the distortion and the stiffness of the bond vibrations that respond to the electronic transition. This gives rise to a crude categorization of contributions to λ - an inner component, λi, which reflects the molecular response of the donor and acceptor cofactors, and an outer component, λo, which arises from the solvent polarization response to the change in charge distribution. In many cases, the structures of biological cofactors, such as large conjugated macrocycles, minimize λi and the major contribution is from the solventenvironment,which is primarily the protein matrix rather than the true aqueous solvent, as biological redox centers are at least partially shielded from the latter. More sophisticated versions that include quantization of the nuclear vibrations, allow the distinction between λi and λo to be made explicit. From the Marcus equation, one can relate the activation free energy (and hence the temperature dependence) of a reaction to the standard free energy change, ∆G0, and to thereorganization energy of the “solvent coordinate”, which includes all vibrations that arecoupled to the electronic transition. The Marcus theory was originally formulated for bimolecular reactions in solution, and two additional terms were included to account for the necessity of forming an encounter complex between the reactants. These are wr and wp, the work involved in bring the reactants together and in separating the products, respectively. Incorporating these, the classical expression becomes:
where ∆G0obs = ∆G0 + wr-wp, and ∆G0 is the free energy of reaction within the encountercomplex. In cases where ∆G0 is large, the influence of wr and wp is small and they arecommonly neglected. In biological ET, the cofactors are often preorganized and thework terms are appropriately absent. The concept and investigation of free energy relationships (FERs) predate Marcus theory by many decades. The earliest example is the Brönsted relationship, which relatesthe rates of proton transfer reactions (and hence the activation free energy) to the differences in pKas of the donor and acceptor (the standard free energy of the reaction, ∆G0). A limited range of ∆G0 yields linear FERs, but more extensive data sets invariably show curvature suggestive of a quadratic dependence. The success of Marcus theory as a mechanistically meaningful, theory-based description of a quadratic FER in ET, led to adoption of it as a basis for PT and for more complex reactions, including atomand small group transfersand enzyme catalysis, and it has been widely used and explored. However, while undoubtedly useful, it is fundamentally inappropriate and its success relies on correlation rather than any real mechanistic underpinnings.
A very general (“interpretation free”) analysis of the relationship between activation free energy and standard free energy of reaction is to consider a FER as a Maclaurin series expansion: ∆G0* is the “intrinsic” activation free energy encountered for a reaction with no driving force (∆G0 = 0). α = d∆G*/d∆G0 is the Brönsted coefficient, and reflects the change in activation free energy as the driving force changes, and α0 is the value of α when ∆G0 =0. When recast in the form of the original Marcus theory, we find:
In the language of physical organic chemistry, the activation free energy, ∆G*, is considered to comprise two distinct contributions – a “kinetic” component or intrinsic activation free energy, ∆G0*, and a “thermodynamic” component, ∆G0 (see next Figure). ∆G0*,being equal to the free energy required to distort the reactant or product states to thetransition state configuration for a reaction with ∆G0 = 0, is identical in concept to thereorganization energy, since λ = 4∆G0* under these circumstances. Like λ, ∆G0* reflectsthe response of the environment and any molecular vibrations coupled to the PT reaction. Although possibly no more than phenomenological, mechanistic significance haslong been sought for free energy relationships. The interpretations are mostly of a qualitative nature, the most notable being the Hammond postulate, from which it follows that the slope (α) of the FER (∆G* vs. ∆G0) reflects the position of the transitionintermediate along the reaction coordinate. This in turn is interpreted as indicatingwhether the structure of the transition intermediate is more like the reactants (α < 0.5) orthe products (α > 0.5). The change in slope (α) along the quadratic curve suggests thatthe transition state of exergonic reactions resembles reactants, while that of endergonicreactions resembles products.
Marcus formalism and adiabatic modification for facile proton transfer. Diabatic curves (parabolas) are shown for reactants (black) and for products for neutral (blue) and endergonic (pink) reactions. The intersection of the black and blue diabats gives the intrinsic barrier of the reaction, ∆G0* or λ/4. The actual activation free energy, ∆G*, on the corresponding adiabatic surface (green) is much smaller and is modified by the coupling energy, Vif, which is substantial. For the endergonic reaction, ∆G* on the adiabatic surface (magenta) is also much smaller than the equivalent diabatic intersection, although not by the same amount - Vif is not constant but varies along the reaction coordinate. Note, also, that the peak (∆G*) is not at the same position on the two adiabatic surfaces - the transition state is closer to the product for the endergonic reaction (Hammond’s postulate).
By comparison with the ET formulation, it is clear that the intrinsic activation free energy (∆G0* = λ/4) is determined by the point of intersection of the diabatic curves. Fornon-adiabatic ET this is a reasonable approximation as the electronic coupling is smalldue to the substantial distance between electron donor and acceptor. For PT, however,the close approach necessary for bond breaking and formation (even if the protontunnels), means that substantial electronic perturbations occur between proton donor andacceptor. Thus, the coupling is large and often on the same order as ∆G0*, itself, so thetrue activation free energy is much less than that indicated by the Marcus equation(see previous Figure). If this adiabatic character is not accounted for, the analysis can only yield asmall activation energy by virtue of an improbably small reorganization energy, and ittherefore grossly misrepresents the microscopic events. Nevertheless, a beguiling correlation remains because the adiabatic transition stateenergy varies in parallel with the diabatic intersection. The absolute magnitudes of ∆G0and ∆G* may not be related by any simple FER, but a linear relationship between δ∆G0and δ∆G* still holds so long as the coupling energy is insensitive to ∆G0. Thus, anychange in the diabatic intersection is reflected in ∆G* even after correction by Vij.
A characteristic feature of Marcus theory for ET, and for the Marcus (quadratic) formalism, generally, is the prediction of an “inverted region” at very large driving forces, i.e., when ∆G0 becomes more negative than -λ, the rate slows down. The rate peaks at ∆G0 = -λ and the width of the log (rate) vs. ∆G0 parabola is proportional to √(λkBT). This prediction for ET was finally confirmed after 20 years. For proton transfer, it was long debated whether an inverted region was possible, and certainly attempts to observe it were commonly confounded by diffusional limitations. However, inverted region behavior has been reported for PT between the radical cation of dimethylaniline and a series of substituted benzophenone radical anions in aprotic solvents. A more convincing demonstration has come from studies using an electron photoinjection method at an electrode interface.
Diabatic curves and adiabatic surface for sequential, multistep proton transfer. Three states are shown for the reaction sequence at the top (charges on PTdonors/acceptors not shown, for generality). The true reorganization energy for thefirst step, λAB, is shown, and that for the second step would be similar (but notidentical as the horizontal displacement is different). The adiabatic surface(dotted) shows that the actual barrier, ∆G*, is barely related to any of the diabaticintersections. Note that the barrier height is not very different from the maximumfree energy difference at the intermediate state (pink). A 2-state Marcus formalismbased on pKa values for the initial donor (A) and final acceptor (C) would require avery different (and smaller) reorganisation energy, “ λAC”, to yield the rightmagnitude for the activation free energy (dashed green parabola, shownintersecting the reactant curve at the same height as the intermediate state).