Download
1 / 30
300 likes | 317 Views
Starlight. • The electromagnetic spectrum • Characteristics of stars • The HR diagram. The electromagnetic spectrum. 1663: Newton buys an astrology book and a glass prism at Sturbridge fair

E N D
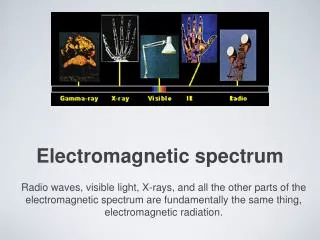
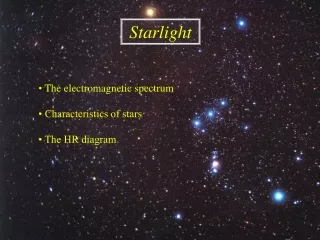
Starlight • The electromagnetic spectrum • Characteristics of stars • The HR diagram
The electromagnetic spectrum 1663: Newton buys an astrology book and a glass prism at Sturbridge fair 1666: in Woolsthorpe family manor, Newton discovers that the prism decomposes solar light in the same colours as the rainbow → shows that white light is composed of different colours He postulates that each monochromatic radiation is composed of particles → photons That hypothesis will be abandoned until the 20th Century, with the discovery that light presents both wave and particle aspects
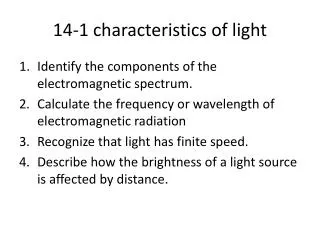
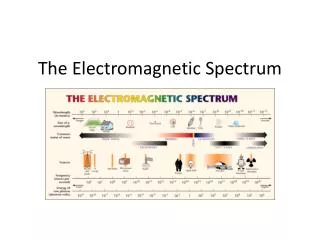
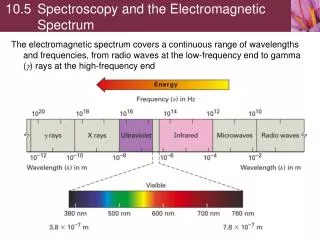
The electromagnetic spectrum - 2 Invisible light Around 1800, Herschel discovers infrared radiation and Ritter ultraviolet radiation Scientists progressively realize that visible radiation represents only a tiny part of the electromagnetic spectrum, corresponding to frequencies detected by the human eye The visible part of the spectrum corresponds to: • maximum of solar emission • excellent transparency of Earth atmosphere → natural selection (Darwin) Herschel Ritter
The electromagnetic spectrum - 3 Spectral domains Historical – also correspond to different processes Frequency ν – wavelength λ: Velocity of light: c = 3 × 10⁸ m/s Energy: Planck constant: h = 6.63 × 10⁻³⁴ J·s
The electromagnetic spectrum - 4 The black body (1) Perfectly absorbing body → only radiation emitted by the objet, because of its temperature, is detected (no reflexion) Hotter body → emission peak λmaxat higher frequency Wien’s displacement law: C ≈ 3 × 10⁻³ m·K ≈ 3000 μm·K Examples: Sun: T≈ 5800 K → λmax≈ 0.5 μm Earth: T≈ 300 K → λmax ≈ 10 μm
The electromagnetic spectrum - 5 The black body (2) Stefan-Boltzmann’s law: Total flux = total energy emitted per unit surface and time Stefan’s constant: σ ≈ 5.7 × 10⁻⁸ W·m−2K−4 Planck’s law: Emitted flux per unit frequency: Jozef Stefan
The electromagnetic spectrum - 6 The black body (3) Planck’s law: Emitted flux per unit wavelength: Or: c1 ≈ 3.7 × 10⁻¹⁶ J·m2s−2 c2 ≈ 0.0144 m·K Conservation of energy → Max Planck
E e– (1) (2) e– The electromagnetic spectrum - 7 Types of spectra Light bulb → continuum spectrum Hot gas → emission lines (1) Cool gas in front of light bulb → continuum + absorption lines (2)
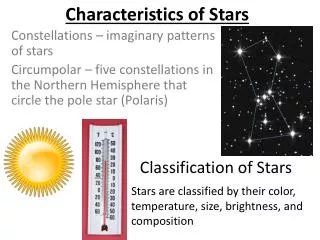
Characteristics of stars Stellar spectra Generally: continuum + absorption lines Stellar interior very hot and opaque → continuum spectrum Outer layers more transparent and cooler → absorption lines Remark: Astronomers often measure wavelength in Angström (Å) 1 Å = 10−10 m = 0.1 nm
Characteristics of stars - 2 Spectral types Classification according to spectrum (ex : strength of hydrogen lines) → O B A F G K M sequence (Oh be a fine girl kiss me…)
Characteristics of stars - 3 Appearance of stellar spectra Spectrum appearance depends on gas properties: • temperature • pressure • chemical composition Temperature is the dominant factor → spectral types correspond to a classification according to temperature of outer layers (stellar atmosphere) Remarks:• stellar surface is not a precisely defined concept as gas pressure gradually increases with depth • spectral types are divided into sub-types (0 to 9) → ex: A0, G2
Characteristics of stars - 4 Effective temperature Surface temperature is not a well defined concept → one introduces effective temperature Teff Teff = temperature of a black body emitting the same flux as the star Bolometric luminosity Lbol = total energy emitted by unit of time (power) (R = radius of the star)
R d Characteristics of stars - 5 Influence of distance Radiation F0 emitted by the star is spread over a sphere of radius R If d is the distance between the star and the observer, the same energy is spread over a sphere of radius d (→ surface 4πd2) Conservation of energy → geometricaldilution:
d θ a Characteristics of stars - 6 Distance to stars Distances of nearby stars can be obtained by triangulation Motion of Earth around the Sun allows to measure parallax In the course of a year, a nearby star seems to move with respect to background stars along an ellipse of semi major axis: 1 parsec = distance of a star whose parallax θ = 1″ 1 parsec (pc) = 1 AU × nr of seconds / radian 1 pc = 206265 AU ≈ 3.26 light-years (L.Y.) ≈ 3 × 10¹⁶ m
Characteristics of stars - 7 Stars in the solar neighborhood Larger parallaxes < 1″ → d > 1 pc 117 stars known at less than 20 L.Y. (in 2006) Mean distance 3D sketch of solar neighborhood
Characteristics of stars - 8 Nearest stars The 117 stars at less than 20 L.Y., by spectral type: OBAFGKMbr.dw. w.dw. 0 0 2 1 6 16 78 8 6 Our nearest neighbors: The Sun (G2) 8 light-minutes Proxima Centauri (K5) 4.2 L.Y. Alpha Centauri A (G2) 4.4 L.Y. Alpha Centauri B (K0) 4.4 L.Y. Barnard star (M5) 5.9 L.Y.
Characteristics of stars - 9 Magnitudes Hipparcos classified the naked-eye stars according to their apparent brightness, from 1st magnitude – brightest ones – to 6th– faintest ones Eye sensitivity follows a logarithmic law To stick as much as possible to Hipparcos system, astronomers defined the apparentmagnitude of a star: Sirius : m = –1.5 Vega : m = 0.0 Canopus : m = –0.7 Capella : m = 0.0 Arcturus : m = –0.1 Rigel : m = 0.1
Characteristics of stars – 10 Absolute magnitude and distance modulus Apparent magnitude is not an intrinsic property of a star as it depends on its distance R is generally unknown → one defines absolutemagnitude MM = apparent magnitude the star would have at a distance of 10 pc Distance modulus:
Characteristics of stars – 11 Photometry In modern astronomy, on always observe through filters which transmit only part of the electromagnetic spectrum → measurement of flux received in a given spectral band → the choice of filters determine the photometric system → a magnitude is always given with reference to a filter Ex :mB, mV, MB, MV,… The additive constant Ct is fixed with reference to standard stars ex:mi(Vega) = 0 in all filters Transmission curves of UBVRI filters
Characteristics of stars – 12 Colours To quantify the colour of a star (or another celestial body), colour indices are defined Ex:mB–mV = MB–MV independent of distance as geometric dilution does not depend on wavelength Colour indices are written B–V,V–R, etc… Remark: they are intrinsic properties of stars if nothing modifies the spectrum in between source and observer (ex: absorption by dust) Transmission curves of UBVRI filters
B–V 1.5 1.0 0.5 0.0 O B A F G K M Spectral type Characteristics of stars – 13 Spectral types and colours Different effective temperatures correspond to: • different spectral types • different colours → relation between spectral type and colour of a star • approximative since both depend on other parametersf (ex. pressure and chemical composition)
Characteristics of stars – 15 • Let κ(λ) be the absorption coefficient of the atmosphere per unit of mass and ρ its density (mass per unit volume) Optical depth τ(λ) is defined by: sec Z is also called the airmass (1 at zenith, increasing near horizon)
MV −5 0 +5 +10 O B A F G K M Spectral type The HR diagram Around 1910, Ejnar Hertzsprung and Henry Norris Russell plot stars in an `absolute magnitude – spectral type´ diagram They realize that stars do not appear at random but into specific areas: • most stars are located along the main sequence • a minority appear in the red giant area • a few are located in the white dwarf region red giants main sequence white dwarfs
log Lbol log Teff The HR diagram - 2 The theoretical HR diagram absolute magnitude ↔ luminosity in spectral band considered spectral type ↔ effective temperature → theoreticians use a theoretical HR diagram in which bolometricluminosity is plotted as a function of effective temperature (in logarithmic scale)
log (L/L ) +4 100R +2 10R 0 R −2 1.0 0.5 0.0 log (Teff /Teff, ) The HR diagram - 3 Influence of radius → straight lines of constant radius in HR diagram • stars located to the upper right of the main sequence are giants and supergiants • main sequence stars are generally called dwarfs • stars located below the main sequence are subdwarfs and white dwarfs
The HR diagram - 4 Luminosity classes Beside spectral types, luminosity classes have been introduced For a given Teff, a ≠ luminosity corresponds to a ≠ radius Classes : I, II : supergiants III : giants IV : subgiants V : dwarfs Ex : Sun: G2V Canopus: F0II
V V−R H.N. Russell E. Hertzsprung The HR diagram - 5 The colour-magnitude diagram If stars belong to a same cluster → they are approximately at the same distance → we can use apparent magnitude instead of absolute magnitude A colour index is often used to measure Teff (more easily obtained than a spectrum) →the observational HR diagram is often a colour-magnitude diagram
The HR diagram - 6 Colour-magnitude diagram of a globular cluster Very useful tool to study stellar evolution Sample of stars at: • same distance • same age • same chemical composition • different masses → study stellar evolution Colour-magnitude diagram of M13 cluster
The HR diagram - 7 Colour-magnitude diagram of nearby stars Parallaxes determined by Hipparcos satellite (most accurate to date) • majority of dwarfs (on main sequence) • minority of giants • a few subdwarfs • a few white dwarfs c-m diagram of nearby stars