data and decisions overview
Data and Decisions Overview. Assessment Tasks. Syndicate groups. Using EXCEL: Should be able to handle files of data, create basic charts and tables with confidence.Think systematically about quantitative business choices that involve uncertainty. Specifically, to identifythe key drivers of the decision. those elements that can be controlled and not controlledtrade-offs and risks. Identify, understand and describe the relationships between business inputs and outputs.Appreciate th23

data and decisions overview
E N D
Presentation Transcript
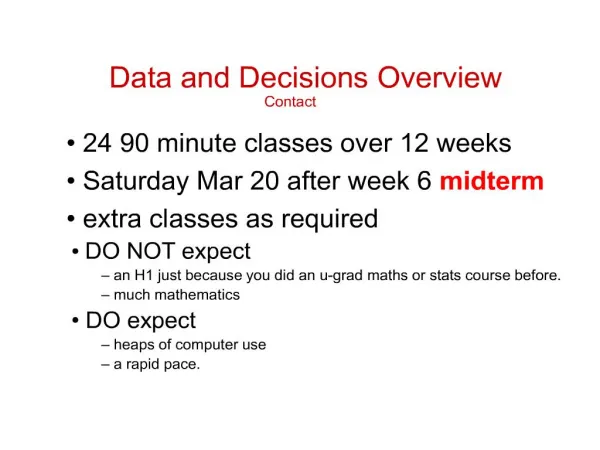
1. Data and Decisions Overview 24 90 minute classes over 12 weeks
Saturday Mar 20 after week 6 midterm
extra classes as required
3. Using EXCEL: Should be able to handle files of data, create basic charts and tables with confidence.
Think systematically about quantitative business choices that involve uncertainty. Specifically, to identify
the key drivers of the decision.
those elements that can be controlled and not controlled
trade-offs and risks.
Identify, understand and describe the relationships between business inputs and outputs.
Appreciate that conclusions from data always involve a level of uncertainty (which can be quantified).
Detect problems and opportunities.
4. Data and Decisions OverviewWhy is it in the core? Excel skills & Data presentation (generic)
Probability and distributions (MP, Finance, ManEc)
Statistics and variation (MP, Finance)
Decision analysis (ManEc)
Regression (everything esp. MP, Finance, Strategy)
Pre-req for Electives
Decision analysis (Wood)
Quantitative Financial Modelling (Smith)
Market Engineering (Danaher)
5. Data and Decisions OverviewPreparing for Course Yesterday!
Copy material from CDROM to Laptop.
Every day
Go to www.mbs.edu/home/lloyd/dnd/ and read Announcements page.
Every Week:
Go to website for class Preparation instructions, syndicate groups, solution files, updates, grades.
6. Data and Decisions OverviewPreparing for Class Before each class: (Details on Preparations page)
Typically: Read classnotes in Topics folders, do some DIY exercises. (60-90 mins)
Submit class prep by email (5-15 mins)
Always bring your laptop.
After each class:
Plenty of DIY exercises are provided (1 hour).
Extra work:
Extensions folder, Saturday classes
MENTIONS POWERPOINT SLIDESMENTIONS POWERPOINT SLIDES
7. Data and Decisions OverviewComputing Requirements Laptop running Windows.
Microsoft Excel (required)
StatproGo installed (see website/CDROM)
Lumenaut Decision Trees (helpful)
8. Topics Covered in Class 1 Data Distribution (AWZ 2.3, 2.6)
Sample mean (AWZ 3.2, 3.5, 3.6)
Sample Standard Deviation (AWZ 3.2, 3.5, 3.6)
Histograms (AWZ 2.3)
9. Data and randomness Random variable � an unpredictable quantity. Repeated observation will produces a spread of values.
52 Weekly sales over 1 year
247 daily returns on a stock during 2006
Salaries of all 273 exec�s in a firm
Winning bids from last 108 auctions
Satisfaction levels of 1120 surveyed customers
WHY ARE EACH OF THESE UNPREDICTABLE?WHY ARE EACH OF THESE UNPREDICTABLE?
10. Data and randomness WORKSHEETS, COLUMNS=VARIABLE AND ROWS=CASE, CELL REFERENCES, DIFFERENT TYPES OF DATA. BREAK OUT TO READ CALL CENTRE CASE. STUDENT BREAKOUT. WHAT ARE THE PERFORMANCE MEASURES? WHICH VARIABLES ARE RELATED TO WHICH?WORKSHEETS, COLUMNS=VARIABLE AND ROWS=CASE, CELL REFERENCES, DIFFERENT TYPES OF DATA. BREAK OUT TO READ CALL CENTRE CASE. STUDENT BREAKOUT. WHAT ARE THE PERFORMANCE MEASURES? WHICH VARIABLES ARE RELATED TO WHICH?
11. Call Centre data WORKSHEETS, COLUMNS=VARIABLE AND ROWS=CASE, CELL REFERENCES, DIFFERENT TYPES OF DATA. BREAK OUT TO READ CALL CENTRE CASE. STUDENT BREAKOUT. WHAT ARE THE PERFORMANCE MEASURES? WHICH VARIABLES ARE RELATED TO WHICH?WORKSHEETS, COLUMNS=VARIABLE AND ROWS=CASE, CELL REFERENCES, DIFFERENT TYPES OF DATA. BREAK OUT TO READ CALL CENTRE CASE. STUDENT BREAKOUT. WHAT ARE THE PERFORMANCE MEASURES? WHICH VARIABLES ARE RELATED TO WHICH?
12. Call Centre data WORKSHEETS, COLUMNS=VARIABLE AND ROWS=CASE, CELL REFERENCES, DIFFERENT TYPES OF DATA. BREAK OUT TO READ CALL CENTRE CASE. STUDENT BREAKOUT. WHAT ARE THE PERFORMANCE MEASURES? WHICH VARIABLES ARE RELATED TO WHICH?WORKSHEETS, COLUMNS=VARIABLE AND ROWS=CASE, CELL REFERENCES, DIFFERENT TYPES OF DATA. BREAK OUT TO READ CALL CENTRE CASE. STUDENT BREAKOUT. WHAT ARE THE PERFORMANCE MEASURES? WHICH VARIABLES ARE RELATED TO WHICH?
13. Data Distribution A list of all distinct observed values of the variable together with the number of times it was observed. Key word: distribution
Also called frequency distribution
Proportion, ratioProportion, ratio
14. Data Distribution Nominal data
Nominal data
15. Data Distribution Ordinal data. Similar to student survey. Called LIkert scale.
In my spreadsheet, ranges are already named. DON�T FORGET TO SHOW how to convert scatterplot to barchart FOR SECOND CHART.Ordinal data. Similar to student survey. Called LIkert scale.
In my spreadsheet, ranges are already named. DON�T FORGET TO SHOW how to convert scatterplot to barchart FOR SECOND CHART.
16. Charts: Gotta luv �em!
17. Data and randomness Three questions that good business managers ask themselves when they look at �the numbers�:-
18. Sample Mean The sample mean measures the middle of a set of numbers (centre of balance)
19. Sample Mean If the data are very variable, then a single number will not give much information about the dataset.
20. Sample Mean If the data are not very variable, then a single number tells you a lot about the variable.
21. Sample Mean The sample mean measures the middle of a set of numbers (centre of balance)
It is a single number representing the overall typical magnitude of values in the data set.
USE STATPRO AT LEAST ONCE: ex1: 3.06, ex2: 3.73, ex3: 3.29USE STATPRO AT LEAST ONCE: ex1: 3.06, ex2: 3.73, ex3: 3.29
22. Averages can be misleading.
Divide the total number of testicles in Australia by the population and you arrive at the disconcerting conclusion that the average number of testicles is�.. One (or slightly less)!
Sample Mean Market segments! Design undies for one testicle?? Segmentation is NON RANDOM variation.Market segments! Design undies for one testicle?? Segmentation is NON RANDOM variation.
23. Sample Standard Deviation The sample standard deviation measures the variability of a set of numbers
24. Sample Standard Deviation It is a single positive number describing the typical variation of data values from the mean.
25. Sample Standard Deviation It is not affected by adding a constant to all values in the data set. +1
26. Sample Standard Deviation It is not affected by adding a constant to all values in the data set. +1
27. Sample Standard Deviation It is not affected by adding a constant to all values in the data set. -3
28. Sample Standard Deviation It is affected by rescaling data eg. changing from AUD to USD. @69c
29. Sample Standard Deviation It is affected by rescaling data eg. changing from AUD to USD. @69c
30. Sample Standard Deviation Formula below is for the standard deviation squared. Standard deviation is v of this.
Meaning is important. It measures variability.
Calculate in Excel with STDEV. GIVES STRANGE ANSWERS FOR VERY SMALL SAMPLES BECAUSE OF THE n/(n-1)GIVES STRANGE ANSWERS FOR VERY SMALL SAMPLES BECAUSE OF THE n/(n-1)
31. Sample Standard Deviation Typical range: Around 65-75% of the data should be within about 1 standard deviation of the mean.
Reasonable range: Around 90-98% of the data should be within about 2 standard deviations of the mean.
DO THE TESTICAL EXAMPLE ON THE TEMPLATE
DO THE TESTICAL EXAMPLE ON THE TEMPLATE
32. THESE ARE COMPLAINTS PER HOURTHESE ARE COMPLAINTS PER HOUR
33. Sample Standard Deviation The sample standard deviation measures the variability of a set of numbers
It is affected by rescaling data eg. changing from USD to AUD.
34. Tabulating Means A very useful tool in Excel is Pivotables
It is found under the Data menu in 03 or at the left of the Insert toolbar in 07.
Breaks data into subsets and gives summary (eg. Mean, Stdev) for each.
Are males different to females?
How does hold/service affect rating?
Look first at ratings by gender using count. Look at rating by holding and service. Using GROUPS
STUDENT BREAKOUT. Look at effect of hold on rating by gender. This answers the patience question.Look first at ratings by gender using count. Look at rating by holding and service. Using GROUPS
STUDENT BREAKOUT. Look at effect of hold on rating by gender. This answers the patience question.
35. Tabulating Means A very useful tool in Excel is Pivotables
It is found under the Data menu in 03 or at the left of the Insert toolbar in 07.
Are males less patient than females?
Look first at ratings by gender using count. Look at rating by holding and service. Using GROUPS
STUDENT BREAKOUT. Look at effect of hold on rating by gender. This answers the patience question.Look first at ratings by gender using count. Look at rating by holding and service. Using GROUPS
STUDENT BREAKOUT. Look at effect of hold on rating by gender. This answers the patience question.
36. KEY TAKE AWAYS FROM CLASS Data distribution summarises large set of numbers stores in Excel column. Histogram when variable is on too fine a scale.
Sample mean measure typical/central value. Standard deviation describes typical variation about mean.
Excel:
37. Histograms Why?
Some variables can take a large or even infinite number of possible values
? data distribution same as list of data. USE COUNTIF FOR TIME AND WAIT VARIABLES OF CALL CENTREUSE COUNTIF FOR TIME AND WAIT VARIABLES OF CALL CENTRE