
Streamflow Forecasting Project for Big Hole River - Melrose, Montana
E N D
Presentation Transcript
Streamflow ForecastingProject By: JD Emmert Derek Rapp
OBJECTIVE • The purpose of this project is to identify the large scale climate signals that affect the streamflow of the Big Hole River and to simulate streamflow scenarios given a probabilistic forecast of the climate signals. • Determine the 100-year flood for flood control designs. • Develop models to estimate the monthly streamflow using parametric and nonparametric approaches.
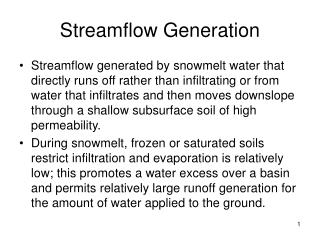
High flows occur in the spring months and are primarily driven by snowmelt. Therefore the climate signal comes in the previous winter.
Climate Signal Indicators • ENSO (El Nino Southern Oscillation) • PDO (Pacific Decadal Oscillation) • PNA (Pacific/North American Pattern Index) These climate signals were scatterplotted against the streamflows. The climate signals were also correlated with the streamflows.
Flow vs. ENSO Flow vs. PDO Flow vs. PNA -0.3013 -0.2873 -0.2699
The means are shown to be different. • The variances are shown to be similar The t-test and F-test we performed agree with this.
Conditional and Unconditional Probabilities • ENSO categories • High ENSO > 7.0 • Low ENSO < -7.0 • Neutral ENSO is in between. • Flow categories • Broken into 33rd percentiles. • Probabilistic Forecast • P(high ENSO) = 0.2 • P(low ENSO) = 0.5 • P(neutral ENSO) = 0.3
Theorem of Total Probability • P(high flow) = 0.4020 • P(low flow) = 0.2716 • P(nuetral flow) = 0.3265 We chose a higher probability for the low ENSO and this results in a higher probability for high flows.
Streamflow Scenarios Historical Value Given the forecast for climate signals as shown earlier, this is where the flow for the following spring would be expected to fall.
Histogram for Annual Maximum Flow Gamma distribution is the best fit based on KS test
100 year flood estimates for different methods. Gamma 579 cms Log-normal 665 cms Log-Pearson III 574 cms Extreme Value I 587 cms LOCFIT 769 cms
Models of Monthly Streamflow • Parametric AR(1) model • Lag-1 Nonparametric K-NN model Models simulate the months of May and June because they exhibit interesting distributions. Key statistics are mean, standard deviation, skew, maximum, minimum, and correlation.
Mean Std. Dev. Skew Parametric AR(1) Max Min Correlation
Mean Std. Dev. Skew Lag-1 Nonparametric K-NN Max Min Correlation