Download
1 / 17
170 likes | 186 Views
Learn how to measure reaction rates using the loss in mass method and explore the effects of concentration and temperature on reactions. Conduct experiments, record data, and analyze results to understand the dynamics of chemical reactions.

E N D
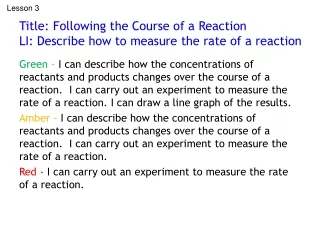
Lesson 3 Title: Following the Course of a ReactionLI: Describe how to measure the rate of a reaction Green – I can describe how the concentrations of reactants and products changes over the course of a reaction. I can carry out an experiment to measure the rate of a reaction. I can draw a line graph of the results. Amber - I can describe how the concentrations of reactants and products changes over the course of a reaction. I can carry out an experiment to measure the rate of a reaction. Red - I can carry out an experiment to measure the rate of a reaction.
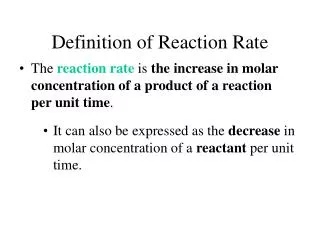
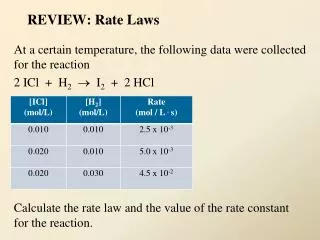
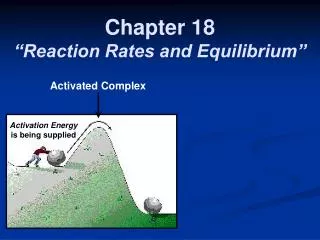
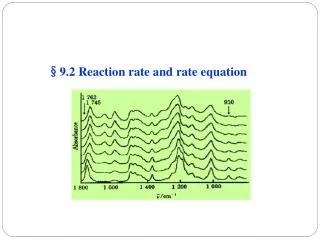
Measuring the Rate of a Reaction • The rate of a reaction can be measured by following the changes in reactants or products • Examples include measuring the volume of gas produced or the mass of gas lost
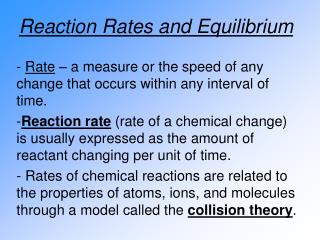
Reactions do not proceed at a steady rate. They start off at a certain speed, then they get slower and slower until they eventually stop. • As the reaction proceeds, the concentration of the reactants decreases. • This reduces the frequency of collisions between particles and so the reaction slows down.
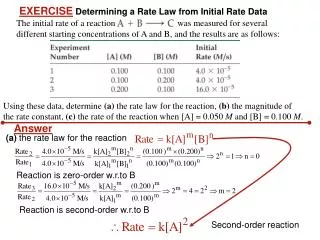
1 2 3 4 5 0% 25% 50% 75% 100% reactants products 5 4 quantity of product 3 1 2 time (min)
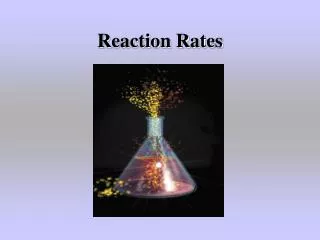
Rate of Reaction: Marble Chips and Hydrochloric Acid Loss in Mass Method The effect of concentration of acid or size of marble chips on the rate of reaction can be determined by measuring the loss in mass of the marble chips. In this experiment, a known mass of marble chips is added to hydrochloric acid. As the reaction progresses there will be a loss of mass. The equipment used is shown.
Measuring Rate – Loss in Mass Method The mass of gas produced over time can be measured by recording the starting mass and then working out the difference in mass at each time interval e.g. every 30 seconds. The rate can then be calculated from this data Cotton wool stopper to absorb splashes Conical flask Acid + marble chips 111.11g T balance Draw in Techniques jotter
Practical Activity 1.3Measuring the Rate of Reaction AIM: to determine the rate of reaction by loss in mass. Method: • Put the following items on a top-pan balance: small conical flask containing about 10 g of marble chips in six or seven lumps, measuring cylinder containing 50 cm3 of 1 M hydrochloric acid OR 50cm3 of 2M acid, plug of cotton wool for the top of the conical flask. Record the total mass in the time 0 row of your table. • Pour the acid into the conical flask, plug the top with the cotton wool, and put the measuring cylinder back on the balance pan. Start the timer. Do not stop the timer. • Record the total mass of the whole reaction mixture and apparatus at intervals of 30 seconds, until the reaction is over and the mass no longer changes. Record the final mass. • Work out the mass of carbon dioxide at the time intervals. Results:
Results: Conclusion:
Using your graph, answer the following questions for 0.5 M then 1M • At which time interval is rate of reaction the fastest? • At what time is the reaction complete? • What is the volume of gas produced after i) 50 seconds ii) 190 seconds d) How are the graphs different? What effect does increasing the concentration of the acid have on the rate of reaction? e) Sketch a line on your graph to show how the reaction would proceed if the reaction was carried out at a higher temperature.