
RMS=3.61%
RMS=9.03% . RMS=3.61%. RMS=5.26% . Photothermal spectroscopy. Rotem Neeman & Yonat Milstein under the supervision of Prof. Israel Gannot, Dr. Moshe Ben David & Michal Tepper

RMS=3.61%
E N D
Presentation Transcript
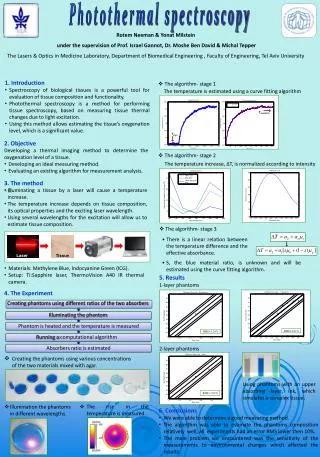
RMS=9.03% RMS=3.61% RMS=5.26% Photothermal spectroscopy Rotem Neeman & Yonat Milstein under the supervision of Prof. Israel Gannot, Dr. Moshe Ben David & Michal Tepper The Lasers & Optics in Medicine Laboratory, Department of Biomedical Engineering , Faculty of Engineering, Tel Aviv University • 1. Introduction • Spectroscopy of biological tissues is a powerful tool for evaluation of tissue composition and functionality. • Photothermal spectroscopy is a method for performing tissue spectroscopy, based on measuring tissue thermal changes due to light excitation. • Using this method allows estimating the tissue’s oxygenation level, which is a significant value. • The algorithm- stage 1 The temperature is estimated using a curve fitting algorithm Tsaturation Tstart • 2. Objective • Developing a thermal imaging method to determine the oxygenation level of a tissue. • Developing an ideal measuring method. • Evaluating an existing algorithm for measurement analysis. • The algorithm- stage 2 The temperature increase, ΔT, is normalized according to intensity • 3. The method • Illuminating a tissue by a laser will cause a temperature increase. • The temperature increase depends on tissue composition, its optical properties and the exciting laser wavelength. • Using several wavelengths for the excitation will allow us to estimate tissue composition. • The algorithm- stage 3 • There is a linear relation between the temperature difference and the effective absorbance. Laser Tissue • S, the blue material ratio, is unknown and will be estimated using the curve fitting algorithm. • Materials: Methylene Blue, Indocyanine Green (ICG). • Setup: Ti:Sapphire laser, ThermoVision A40 IR thermal camera. 5. Results 1-layer phantoms 4. The Experiment 2-layer phantoms • Creating the phantoms using various concentrations of the two materials mixed with agar. Using phantoms with an upper absorbing layer, ink, which simulates a complex tissue. • The rise in the temperature is measured. • Illumination the phantoms in different wavelengths. • 6. Conclusions • We were able to determine a good measuring method. • The algorithm was able to estimate the phantoms composition relatively well, all experiments had an error RMS lower then 10%. • The main problem we encountered was the sensitivity of the measurements to environmental changes which affected the results.