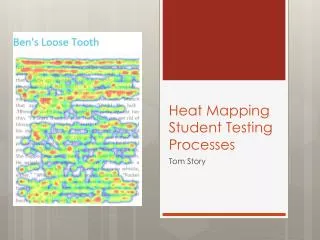
Heat Mapping Student Testing Processes
With 14 years of experience in education and a background in web design, I explore the evolution of online standardized testing from 2005 to present. This analysis incorporates innovative heat mapping technology to track student engagement during assessments, shedding light on reading comprehension and student accountability. By utilizing this visual tool, educators can identify areas of focus for reluctant readers and improve their instructional practices. Join me in examining the impact of heat mapping on student outcomes and explore practical tips for implementation.

Heat Mapping Student Testing Processes
E N D
Presentation Transcript
Heat Mapping Student TestingProcesses Tom Story
Introduction • Teacher for 14 years in MPS • Web Designer since 2007 • Technology Interests in Testing
ADHD Slide • Tracking Mouse Movement • http://readheat.com • Teacher name is iud78zmi • Go Play. We’ll catch up to later!
Online Standardized Testing History • 2005 – Student quizzes were online • 2009 – Student online testing for Houghton Mifflin Reading series • 2011 – MAPS online • 2014 – CCSS/ Smarter Balanced / PARCC
Teacher Accountability • It started out as online tests as tools to assess students and find areas for teachers to target in their classrooms. • Now - In year 1 of EEP, school reading comprehension score account for 5% of of review, and will dramatically increase after.
Website Marketing • Heat Maps • Analytics Images • Clicks/Flow • 19 Tips We Learned From Heat Tracking • Study on F Pattern Reading
Online Reading Patterns • F- Shape patterns • Books are read different than online materials • Sitting and posture on computer
Test Technologies • Smarter Balanced Example • PARCC Examples
Heat Mapping • Used in many different places. A visual tool to get an idea of how things move or are being used
Heat Mapping Test PracticeReadHeat.com • Algorithm of time where mouse is spent and is flowing to • Timer is added to output to show how long student spent • Both Text and Questions • Can be anonymous • Email sent to teacher
Student Accountability • Students initially are just logging into a test practice • Once students catch on they are being watched, they spend more time. • Once they see heat map and the expectation, they spend more time on reading text.
Student Findings • Who is this really for? • Reluctant readers – high and low • Low students that seem to be rushing through testing
ADHD Follow up • Let’s Try this
Contact • tom@venataur.com