Download

1 / 20
200 likes | 406 Views
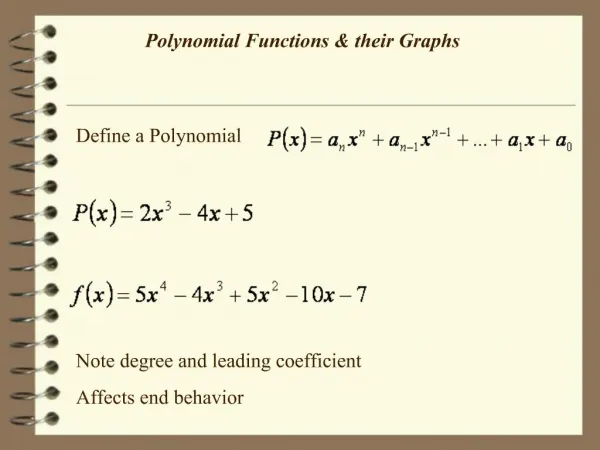
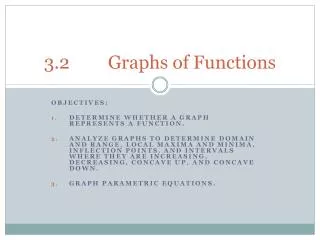
3.2 Graphs of Polynomial Functions. The degree is the highest exponent of a function The leading coefficient is the # in front of the variable with the highest exponent. Vocabulary. End behaviors of graphs (also called the Lead Coefficient Test).

E N D
3.2 Graphs of Polynomial Functions • The degree is the highest exponent of a function • The leading coefficient is the # in front of the variable with the highest exponent. Vocabulary
End behaviors of graphs(also called the Lead Coefficient Test) 1. If the degree is even, the ends of the graph both go in the same direction 2.If the degree is Odd, the ends of the graph go in Opposite directions
How do we determine the direction(s) for the ends of a graph of a polynomial of even degree? • If the lead coefficient is NEGATIVE then the graph is “sad” and both ends go down in a frown! • If the lead coefficient is POSITIVE then the graph is “happy” and both ends go up in a smile!
How do we determine the direction(s) for the ends of a graph of a polynomial of ODD degree? • If the lead coefficient is NEGATIVE then think of a negative slope line. It starts out up and goes DOWN. • If the lead coefficient is POSITIVE then think of a positive slope line. It starts out down and goes UP.
http://www.brightstorm.com/math/precalculus/polynomial-and-rational-functions/graphing-polynomial-functions/http://www.brightstorm.com/math/precalculus/polynomial-and-rational-functions/graphing-polynomial-functions/
Determine the left and right behavior of the graph of each polynomial function. 1. f(x) = x4 + 2x2 – 3x 2. f(x) = -x5 +3x4 – x 3. f(x) = 2x3 – 3x2 + 5
Find all real zeros of… Ex. Factor first (if possible) ALWAYS Zeros are x = 0 x = 2 x = -1
Find all real zeros Ex. f(x) = x3 + x2 – 6x How do you test if your zeros are correct?
Example Find all real zeros f(x) = -3x4 + 12x2
Repeated zeros (multiplicity) x2 = 0 (x+3)(x+3)(x+3) = 0 x = 0, 0 x = -3, -3, -3 0 is a repeated zero of multiplicity two -3 is a repeated zero of multiplicity three
Repeated zeros If the multiplicity is ODD, the graph crosses at that zero If the multiplicity is EVEN, the graph touches at that zero
Find all real zeros… (Use your calculator) How many zeros should this function have? How many times will the graph cross the x axis? Why do we only see three zeros?
Find the polynomial function with the following zeros Ex. -2, -1, 1, 2
Ex Find the polynomial function with the following zeros 3, 2, -2