Download

1 / 10
100 likes | 258 Views
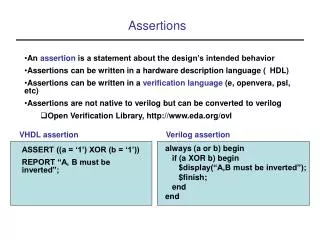
Modeling Assertions: Symbolic Model Representation of Application Performance. Jeffrey S. Vetter (PI) Sadaf R. Alam, Nikhil Bhatia Future Technologies Group Computer Science and Mathematics Division. Modeling assertions. What?

E N D
Modeling Assertions: Symbolic Model Representation of Application Performance Jeffrey S. Vetter (PI) Sadaf R. Alam, Nikhil Bhatia Future Technologies Group Computer Science and Mathematics Division
Modeling assertions • What? • Portable and extensible workload and performance modeling framework • Why? • Provide an integrated solution to develop, validate, and experiment with symbolic performance models of large-scale applications • Provide an efficient mechanism for sensitivity analysis and workload project growth rates for future problem and system configurations • Components • A portable API for code annotation • Post-processing tools • Synthetic MPI trace generation with OTF compatible format 2 Vetter_Modeling_SC07
PAP I PMPI MPI task MPI task MPI task MPI task MPI task app MPI task MPI task pomp MPI task MPI task MPI task MPI task MPI task MPI task MPI task MPI task MPI task Modeling workflow Build Execute Application instrumentation Symbolic model Validate offline/online Model validation Control flow model Model generation C-style model
PAP I PMPI app pomp Toward an integrated framework • Online validation, analysis and prediction • Pragma-based instrumentation • Realtime, efficient error reporting mechanisms Build Model validation Application instrumentation Symbolic model Control flow model Execute Validate Analyze C-style model Report statistics
Sensitivity analysis of DOE applications Goal: Identify workload sensitivity at scale before system and application deployment Performance and scaling bottlenecks due to • Application parameters • System parameters Message size distribution in the key calculation phases as the MPI grid topology is scaled
Modeling on emerging architectures Goal: Investigate how performance-enhancing features of emerging architecture benefit scientific calculations Incorporate “application aware” and “architecture aware” parameter in the model Tv = Tvm+ Tvc Ts = Tsm+ Tsc VFLOPS 4.5GHz/18GHz SFLOPS 0.565GHz/2.26GHz Tvc = Tsc = (VLOADS + VSTORES )*8*64 BW *109* AVL (SLOADS + SSTORES )*8 BW *109 Tvm = Tsm = Vector LS OPS Vector FP OPS MVScore AVL 23. call maf_vec_loop_start(1,“tzetar”,“size^2*(size-1)*26”, (size**2)*(size-1)*26,” (size^2)*(size-1)*16”, (size**2)*(size-1)*16,”(size-1)/(size/64+1)”, (size-1)/(size/64+1),3) 24. M-------< do k = start(3,c), cell_size(3,c)-end(3,c)-1 25. M 2-----< do j = start(2,c), cell_size(2,c)-end(2,c)-1 26. M 2 Vs--< do i = start(1,c), cell_size(1,c)-end(1,c)-1 27. M 2 Vs
AVL V FP LS V FP OPS Memory Bandwidth 350 300 250 200 150 100 50 0 -50 -100 Minimum Average Maximum Error (%) W (1) A (1) B (1) C (1) W (4) A (4) B (4) C (4) Problem class (MPI Tasks) Performance projections 8 6 4 2 0 -2 -4 -6 -8 -10 -12 -14 • Average vector length prediction with different • Problem configurations • MPI task Error (%) W (1) A (1) B (1) C (1) W (4) A (4) B (4) C (4) Problem class (MPI Tasks) • Experimented with memory bandwidth values: maximum (stream), minimum (random) and mean of max and min • Performance prediction
Synthetic trace file generation Goal: Generate input traces for future problem and system configurations that do not exist • Prototype for future network design at scale infeasible • Issues: • Realistic and representative workload for petascale and exascale systems. • Problem configurations; for example, input decks for petascale and exascale problems do not exist. • Solution • Generate parameterized network models and traces to drive network simulators. • Support common MPI trace file formats like OTF. • Identify workload scaling behavior and patterns. • Investigate alternate algorithms and implementation.
20 K atoms 200 K atoms 2 M atoms Memory Message size Message count Memory Message size Message count Memory Message size Message count 1.E+09 1.E+08 1.E+07 1.E+06 1.E+05 1.E+04 1.E+03 1.E+02 1.E+01 1.E+00 8 1 2 4 16 32 64 128 256 512 8192 2048 4096 1024 65536 16384 32768 524288 131072 262144 1048576 Workload sensitivity results Number of cores Sensitivity analysis for workload requirements of the PME implementation in SANDER for petaflops scale systems
Contacts • Jeffrey S. Vetter • Principle Investigator • Future Technologies Group Computer Science and Mathematics Division (865) 356-1649 • vetter@ornl.gov • Sadaf R. Alam • (865) 241-1533 • alamsr@ornl.gov • Nikhil Bhatia • (865) 241-1535 • bhatia@ornl.gov 10 Vetter_Modeling_SC07