Download
1 / 32
330 likes | 587 Views
A Multiresolution Symbolic Representation of Time Series Vasileios Megalooikonomou 1 , Qiang Wang 1 , Guo Li 1 , Christos Faloutsos 2 1 Temple University, Philadelphia, USA 2 Carnegie Mellon University, Pittsburgh, USA. Outline. Background Methodology Experimental results Conclusion.

E N D
A Multiresolution Symbolic Representation of Time Series Vasileios Megalooikonomou1, Qiang Wang1, Guo Li1, Christos Faloutsos2 1Temple University, Philadelphia, USA 2Carnegie Mellon University, Pittsburgh, USA
Outline • Background • Methodology • Experimental results • Conclusion
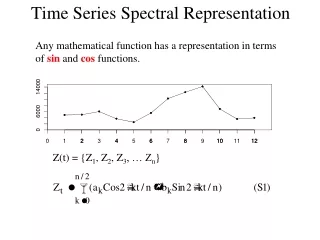
Introduction Time Sequence: A sequence (ordered collection) of real values: X = x1, x2,…, xn …… • Challenges: • High dimensionality • High amount of data • Similarity metric definition
Introduction Goal: To achieve: • High efficiency • High accuracy in similarity searches among time series and in discovering interesting patterns
Introduction • Similarity metric for time series • Euclidean Distance: • most common, sensitive to shifts • Dynamic Time Warping (DTW): • improving accuracy, but time consuming O(n2) • Envelope-based DTW: • improving time complexity, o(n)
Introduction • Similarity metric for time series A more intuitive idea: two series should be considered similar if they have enough non-overlapping time-ordered pairs of subsequences that are similar (Agrawal et al. VLDB, 1995)
Introduction • Dimensionality reduction techniques: • DFT: Discrete Fourier Transform • DWT: Discrete Wavelet Transform • SVD: Singular Vector Decomposition • APCA: Adaptive Piecewise Constant Approximation • PAA: Piecewise Aggregate Approximate • SAX: Symbolic Aggregate approXimation • …
Introduction Suggested Solution: Multiresolution Vector Quantized (MVQ) approximation 1) Uses a ‘vocabulary’ of subsequences 2) Takes multiple resolutions into account 3) Unlike wavelets partially ignores the ordering of ‘codewords’ 3) Exploits prior knowledge about the data 4) Provides a new distance metric
Outline: A Multiresolution Symbolic Representation of Time Series • Background • Methodology • Experimental results • Conclusion
Methodology • A new framework (four steps): • Create a ‘vocabulary’ of subsequences (codebook) • Represent time series using codecords • Utilize multiple resolutions • Employ a new distance metric
Codebook s=16 Generation Series Transformation 1121000000001000 1200010011000000 1000000012001100 1000000011002100 0001010100110010 1010000100100011 …… c mdbca i fajbb m i njjama I njm h ldfkophcako o gcblpoccblh l hnkkkplcacg k kgjhhgkgjlp Series Encoding …… Methodology
Methodology Frequently appearing patterns in subsequences • Creating a ‘vocabulary’ Q: How to create? A: Use Vector Quantization, in particular, the Generalized Lloyd Algorithm (GLA) • Produces a codebook based on two conditions: • Nearest neighbor Condition (NNC) • Centroid condition (CC) • Output: • A codebook with s codewords
Methodology Representing time series X = x1, x2,…, xn is encoded with a new representation f = (f1,f2,…, fs) (fi is the frequency of the i th codeword in X)
Methodology New distance metric: The histogram model is used to calculate similarity at each resolution level: with
Methodology • Time series summarization: • High level information (frequently appearing patterns) is more useful • The new representation can provide this kind of information Both codeword (pattern) 3 & 5 show up 2 times
Methodology Problems of frequency based encoding: • It can not record the location of a subsequence • It is hard to define an approximate resolution (codeword length) • It may lose global information
Methodology Utilizing multiple resolutions: Solution: encoding with multiple resolutions Each resolution level will be complementary to each other Reconstruction of time series using different resolutions
Methodology New distance metric: For all resolution levels a weighted similarity metric is defined as:
Methodology Parameters of MVQ
Methodology Parameters of MVQ • Number of resolution levels • c = log (n / lmin) +1 lmin is the minimal codeword length • Length of codeword (on i th level) • l = n / 2i-1 • Size of codebook • Data dependent. However, in practice, small codebooks can achieve very good results
Outline: A Multiresolution Symbolic Representation of Time Series • Background • Methodology • Experimental results • Conclusion
Experiments Datasets • SYNDATA (control chart data): synthetic • CAMMOUSE: 3 *5 sequences obtained using the Camera Mouse Program • RTT: RTT measurements from UCR to CMU with sending rate of 50 msec for a day
Experiments Best Match Searching: For a given query, time series within the same class as the query (given our prior knowledge) form the standard set (std_set(q) ), and the results found by different approaches (knn(q) ) are compared to this set The matching accuracy is defined as:
Experiments Best Match Searching SYNDATA CAMMOUSE
Experiments Best Match Searching (a) (b) Precision-recall for different methods (a) on SYNDATA dataset (b) on CAMMOUSE dataset
Experiments Clustering experiments Given two clusterings, G=G1, G2, …, GK(the true clusters), and A = A1, A2, …, Ak (clustering result by a certain method), the clustering accuracy is evaluated with the cluster similarity defined as: with
Experiments Clustering experiments SYNDATA RTT .
Experiments Summarization (SYNDATA) Typical series:
First Level Second Level Experiments
Outline: A Multiresolution Symbolic Representation of Time Series • Background • Methodology • Experimental results • Conclusion
Conclusion • A new symbolic representation of time series • Utilizes multiple resolutions • A more meaningful similarity metric • Improved efficiency due to the dimensionality • reduction • Nice summarization of time series • Uses prior knowledge (training process)