Reading Phylogenetic Trees
Reading Phylogenetic Trees. 2010 CBBE at NC A&T Jeff Krause, Shodor (adopted from Gloria Rendon, NCSA). Reading phylogenetic trees: A quick review (Adapted from evolution.berkeley.edu).

Reading Phylogenetic Trees
E N D
Presentation Transcript
Reading Phylogenetic Trees 2010 CBBE at NC A&T Jeff Krause, Shodor (adopted from Gloria Rendon, NCSA)
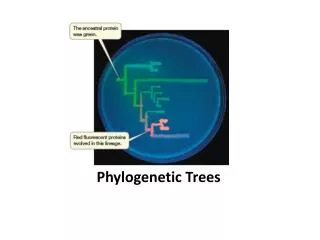
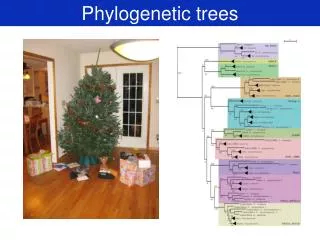
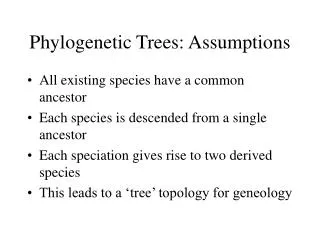
Reading phylogenetic trees: A quick review(Adapted from evolution.berkeley.edu) • A phylogeny, or evolutionary tree, represents the evolutionary relationships among a set of organisms or groups of organisms, called taxa (singular: taxon) that are believed to have a common ancestor.
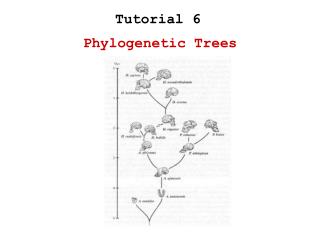
Tips, Internal Nodes, Edges • The tips of the phylogenetic tree represent groups of descendent taxa (often species) and the nodes on the tree represent the common ancestors of those descendents. • The tips are the present and the internal nodes are the past. • The edge lengths in some trees correspond to time estimates – evolutionary time
Sister Groups and a common ancestor • Two descendents that split from the same node are called sister groups. • In the trees above, species A & B are sister groups — they are each other's closest relatives; which mean that: • i) they have a lot of evolutionary history in common and very little evolutionary history that is unique to either one of the two sister species and • ii) that they have a common ancestor that is unique to them.
Equivalent trees • For any speciation event on a phylogeny, the choice of which lineage goes to the right and which goes to the left is arbitrary. The following phylogenies are equivalent:
Outgroup • Many phylogenies also include an outgroup — a taxon outside the group of interest. • All the members of the group of interest are more closely related to each other than they are to the outgroup. Hence, the outgroup stems from the base of the tree. • An outgroup can give you a sense of where on the bigger tree of life the main group of organisms falls. It is also useful when constructing evolutionary trees.
Branches and clades • Evolutionary trees depict clades. • A clade is a group of organisms that are all descendent from a common ancestor; thus a clade includes an ancestor and all descendents of that ancestor. • You can think of a clade as a branch on the tree of life. • Some examples of clades and non-clades in a phylogenetic tree are shown on these trees
More on clades. Nested clades • Clades are nested within one another — they form a nested hierarchy. • A clade may include many thousands of species or just a few. • Some examples of clades at different levels are marked on the phylogenies above. • Notice how clades can be nested within larger clades.
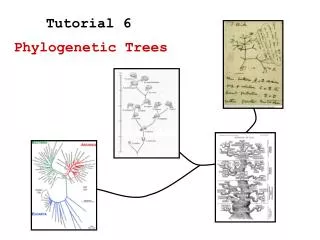
Types of trees: unrooted vs rooted • A rooted phylogenetic tree is a directedtree with a unique root node corresponding to the (usually imputed) most recent common ancestor of all the entities at the leaves of the tree. • Unrooted trees illustrate the relatedness of the leaf nodes without making assumptions about common ancestry.
Cladogram, dendrogram, phylogram • Dendrogram is the ‘generic’ term applied to any type of diagrammatic representation of phylogenetic trees. • Cladogram (to some biologists) is a tree in which branch lengths DO NOT represent evolutionary time; clades just represent a hypothesis about actual evolutionary history • Phylogram (to some biologists) is a tree in which branch lengths DO represent evolutionary time; clades represent true evolutionary history (amount of character change)
Phylogenetic Trees and classification • Phylogenetic trees classify organisms into clades. By contrast, the Linnaean system of classification assigns every organism a kingdom, phylum, class, order, family, genus, and species. The phylogenetic tree depicted below identifies four clades To build a phylogenetic tree biologists collect data about the characters of each organism they are interested in. Characters are heritable traits that can be compared across organisms, such as physical characteristics (morphology), genetic sequences, and behavioral traits. Some molecular biologists (like C. Woese) build phylogenetic trees from genetic sequences alone.