Download
1 / 24
240 likes | 397 Views
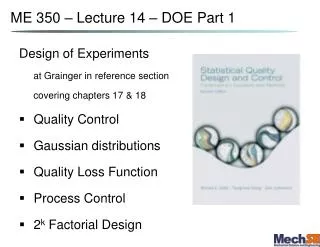
ME 350 – Lecture 14 – DOE Part 1. Design of Experiments at Grainger in reference section covering chapters 17 & 18 Quality Control Gaussian distributions Quality Loss Function Process Control 2 k Factorial Design. Goal of Quality Control.

E N D
ME 350 – Lecture 14 – DOE Part 1 Design of Experiments at Grainger in reference section covering chapters 17 & 18 • Quality Control • Gaussian distributions • Quality Loss Function • Process Control • 2k Factorial Design
Goal of Quality Control Strategic view of Quality Design and Improvement:
Example Experiment Control variable 1, x1: extruder temperature Control variable 2, x2: injection time Output measurement, y: part weight (goal is 25 oz)
Gaussian Distributions Gaussians have: • Mean (average), μ • Standard deviation, σ • Variance, σ2 • Tolerance: 2σ = 4σ = 6σ = Variance of a system: σ2 = Tolerance of a system:σ =
Quality Control: Gaussian Distribution A part with a “hole” must match up with another containing a “pin.” The hole and pin tolerances () are 15 mil. Thus the clearance and clearance tolerance is (assume Gaussian distribution):
Quality Control: Rework Distribution Same problem as before (tolerances are 15 mil). Thus the clearance (with tolerance) is:
Quality Loss Function The deviation of a product from its nominal value typically has a similar deviation in the product performance: Warranties for transmissions with greater variability are more expensive. They tend to follow a:
Common Approaches to Reduce Variability: 1) Choose an output region with less variability for a given input, or 2) tighten the input
DOE is to enable Process Control “You can not manage what you can’t measure” “If you cannot measure it, you can not control it, if you cannot control it, you can not manage it” • Step 1: state and rank objective(s), • Which objectives are “nice” and which are “essential” • How will you measure (i.e. quantify) objective success • Ranking can depend upon consequence of failure • If certain objective fails does someone die or does it produce a product cosmetic blemish? • Objective could be to compare 2 or more venders • Objective could be to optimize one or more product characteristics.
Setting up DOE for Process Control • Step 2: brainstorm possible process variables and rank them • Base ranking on engineering judgment or experience. • Don’t eliminate any potential variables (i.e. factors) • Be specific – don’t just put down “temperature” - temperature of what, where, and when? • Be bold, but not foolish in choosing “high” and “low” settings of each variable for experimentation • try for as wide a distance as possible but not impractical • Check for variable (i.e. factors) settings that are impractical or impossible • e.g. high gas flow but low pressure in gas line
2k Factorial Design – Test Settings • “k” refers to the number of variables being tested • Assumes a linear, or near linear output response when changing an input variable - • Tests points only at the extremes -
DOE Example 1 Objective: better flow of polymer into fine features of mold in injection molding process Quantify objective? Variables?
DOE Example 2 Objective: reduce machining (drill, mill, or lathe) costs to make product. Quantify objective: Material variables: Equipment variables:
DOE Example 3 Objective: improve composite part strength Quantify objective: Material variables: Equipment (or process) variables:
22DOE Example: data analysis Objective is better control part weight: 25 oz. Variable 1: extruder temperature high = 200 C low = 150 C Variable 2: injection time high = 4 sec low = 2 sec Experimental Results: x2 x1
22DOE: determining magnitude of “effects” E1 – ‘effect’ of variable 1, use the average of “high” minus the average of the “low” values x2 x1
Compounded Effects & Characteristic Equation • Compound Effect E12? • Characteristic Equation: x2 x1
23 Factorial Design Example • Study on the alertness of students in the morning • Variables • Design Matrix
food coffee sleep Effect of Variables? • Graphically, the “effect” of variable 1 is the difference between the average results of the planes
Average corners of inscribed regular tetrahedrons of diagonals and subtract One tetrahedron should include the (-,-,-) corner and the other should include the (+,+,+) corner Graphical Understanding (cont)
Use Matrix Algebra to Solve: • Eliminating the “insignificant effects” yields the final equation: • Determining which effects are significant comes next