Download
1 / 37
380 likes | 484 Views
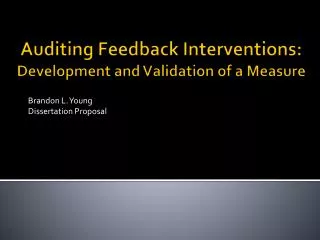
Development of a Public-Domain Measure of Random Responding. Sarah E. Stegall, Darrin L. Rogers, Emanuel Cervantes. Abstract.

E N D
Development of a Public-Domain Measure of Random Responding Sarah E. Stegall, Darrin L. Rogers, Emanuel Cervantes
Abstract • The Semantic Inconsistency Scale (SIS), a no-cost tool for measuring random responding in questionnaire research, was developed and validated in two independent samples. It shows strong initial evidence of validity, able to not only detect computer-generated random responses but also invalid responding caused by more realistic conditions.
Introduction • Invalid responding can threaten validity and interpretation (Huang, 2012; however, see Costa & McCrae, 1997 for alternative views). • Random responding (RR; Archer & Smith, 2008) scales measure participants’ consistency of to pairs of items with similar—or opposite—meanings (e.g., MMPI2 scale VRIN; Butcher et al., 2001; PAI scale INC; Morey, 2007).
Introduction • Methods previously used to develop and evaluate RR scales include: • Comparing responses from participants instructed to answer questionnaires randomly with subjects given standard instructions (Berry et al., 1991; Cramer, 1995; Galen & Berry, 1996) and • Comparing real responses with computer-generated random responses (Charter & Lopez, 2003) • Real-world • More ecologically valid manipulations more externally valid • Not been used so far
Introduction • Commercially-marketed assessmentsonly • Semantic inconsistency scale (SIS) • Public-domain measure of RR for use with questionnaires
Method Participants: • 482 undergraduate students • 75% female, 25% male • 95% Hispanic • Data Collection Phases • Phase 1 (February-July, 2012): • N=286, 75% female. • Phase 2 (August-December, 2012): • N=196, 81% female.
Method Procedures & Materials: • Anonymous online survey • Big Five Inventory (BFI; John & Srivastava, 1999) • SIS item pool I see myself as someone who…
SIS Construction • 30 pairs of items • From International Personality Item Pool (Goldberg et al., 2006)
SIS Construction • Judged to be semantically related • Very similar in meaning • Apparently opposite in meaning
SIS Construction • Degree of inconsistency in responses RR I see myself as someone who… Similar items Difference of 1 Opposite items *Note: reverse coded* Difference of 3
Method Experimental Manipulation: • “Quick” condition (Q or “quick”) • Subtly encouraged to complete the task quickly • In-test messages emphasized importance of students’ time • Control condition (A or “accurate”) • Instructed to complete the survey accurately • In-test messages emphasized accuracy
Method Phase 1 • Selection and validation of final item pairs • Maximized correlations • Resulting 22-item (11-pair) SIS Phase 2 • SIS scale assessed using responses • SIS score = mean discrepancy in SIS pairs(possible range: 0-4)
Results • Q vs. A comparison • Survey completion time • Attention to survey content • Real vs. random responses All results calculated on Phase 2 sample only (unless otherwise specified)
Q vs. A Comparison Median SIS scores Q > A(Wilcoxon test z=2.179, p<.05). Figure 1. Trimmed (20%) means for SIS scores in condition A (“accurate”) versus Q (“quick”).
Survey Completion Time • Correlation • SIS scores • Time to complete the full survey • Spearman’s rho= -.13 (p = .06)
Attention to Survey Content • Multiple choice questions content of survey items they had just seen & responded to • Number of questions answered incorrectly • Prediction: positive correlation with SIS • No association Spearman’s rho= .04 (p > .05)
Real vs. 100% Random Responding • SIS discrimination between • 100% random responding (computer-generated) • Actual participant responses • Compare Phase 2 responses to 100,000 records of randomly-generated responses. • Score SIS on everything • Real scores < Random-response scores (t=31.56, p<.001; Figure 2).
Figure 2. Distribution of true Phase 2 SIS scores (blue) versus randomly-generated profiles (red).
Real vs. 100% Random Responding • SIS sensitivity of discrimination between • True Phase 2 records • Equal number of randomly-generated records • Receiver-Operator Characteristic (ROC) analysis • Area under the curve (AUC) discrimination ability of the test • AUC = .95 (excellent discrimination ability)
Figure 3. ROC analysis for Phase 2 responses vs. (100%) randomly-generated response records.
Real vs. Partial Random Responding • Dataset split in half randomly • Control group: original (real) responses • Random group: X% of responses replaced with random • Randomly-selected X% of responses • X goes from 1% to 100% (i.e., do this process 100 times) Control Group Original (real) Responses Random Group X% replaced with random 1% <X< 100%
Real vs. Partial Random Responding • SIS scored & AUC calculated • SIS discrimination between Control & Random groups
Real vs. Partial Random Responding • Result: SIS discrimination between real and partial (from 1 to 100%) random responding • We repeated this entire process 100 times, to “even out” random selection
100 runs Each run: AUCs comparing real responses to real + partial random 0% to 100% random Mean of 100 AUCs at each point
Figure 4. AUCs for 100 runs of SIS discrimination between original profiles and partially (1% through 100%) random profiles. Light blue lines are AUCs for 100 individual runs; dark blue line indicates mean AUC at each point.
Discussion • Semantic Inconsistency Scale (SIS) • Phase 1: Scale development (22-item/11-pair) • Phase 2: Validated • Identification of random responding • Excellent with 100% random responses • Fair performance even with protocols having less than 20% random responding. • Discriminate between “Quick” & “Accurate”: • Participants primed and instructed to answer hastily • Participants given regular instructions
Discussion • Perform as well as (if not better than) comparable tests • Easily inserted into a variety of psychological and personality tests • Modification of item stems or formats may allow use with an even wider range.
Discussion Limitations and Future Directions: • Not appropriate for all test varieties • Very short research • Clinical protocols • Random responding is not always a problem • Depends on clinical/research situation • SIS might help you know whether it is
Conclusion • SIS = • Robust and valid measure of random responding • FREE: Creative Commons licensed
References Archer, R. P., & Smith, S. R. (2008). Personality assessment. CRC Press. Berry, D. R., Wetter, M. W., Baer, R. A., Widiger, T. A., Sumpter, J. C., Reynolds, S. K., & Hallam, R. A. (1991). Detection of random responding on the MMPI-2: Utility of F, back F, and VRIN scales. Psychological Assessment: A Journal Of Consulting And Clinical Psychology, 3(3), 418-423. doi:10.1037/1040-3590.3.3.418 Butcher, J. N., Graham, J. R., Ben-Porath,Y. S., Tellegen, A., Dahlstrom,W. G.,&Kaemmer, B. (2001). MMPI-2 (Minnesota Multiphasic PersonalityInventory-2): Manual for administration and scoring (2nd ed.). Minneapolis, MN: University of Minnesota Press. Charter, R. A., & Lopez, M. N. (2003). MMPI‐2: Confidence intervals for random responding to the F, F Back, and VRIN scales. Journal of clinical psychology, 59(9), 985-990. Costa Jr., P. T., & McCrae, R. R. (1997). Stability and Change in Personality Assessment: The Revised NEO Personality Inventory in the Year 2000. Journal Of Personality Assessment, 68(1), 86. Cramer, K. M. (1995). Comparing three new MMPI-2 randomness indices in a novel procedure for random profile derivation. Journal of personality assessment, 65(3), 514-520. Gallen, R. T., & Berry, D. R. (1996). Detection of random responding in MMPI-2 protocols. Assessment, 3(2), 171-178. Goldberg, L. R., Johnson, J. A., Eber, H. W., Hogan, R., Ashton, M. C., Cloninger, C. R., & Gough, H. G. (2006). The international personality item pool and the future of public-domain personality measures. Journal of Research in Personality, 40(1), 84-96. Huang, J. L., Curran, P. G., Keeney, J., Poposki, E. M., & DeShon, R. P. (2012). Detecting and deterring insufficient effort responding to surveys. Journal of Business and Psychology, 27(1), 99-114. John, O. P., & Srivastava, S. (1999). The Big Five trait taxonomy: History, measurement, and theoretical perspectives. Handbook of personality: Theory and research, 2, 102-138. Morey, L. C. (2007). Personality assessment inventory (PAI).
Contact • http://www.darrinlrogers.com/dissemination/ • Sarah Stegall: sestegall@broncs.utpa.edu • Darrin Rogers: drogers1@utpa.edu • Emanuel Cervantes: ecervantes72@gmail.com