Download
1 / 19
190 likes | 210 Views
Dive into the latest findings from the Great Britain Tourism Survey March 2017, examining trends in trips, nights, weather, and more to gain insights on tourism patterns. Explore the impact on volume and spend and uncover long-term trends by month and region in this comprehensive summary.

E N D
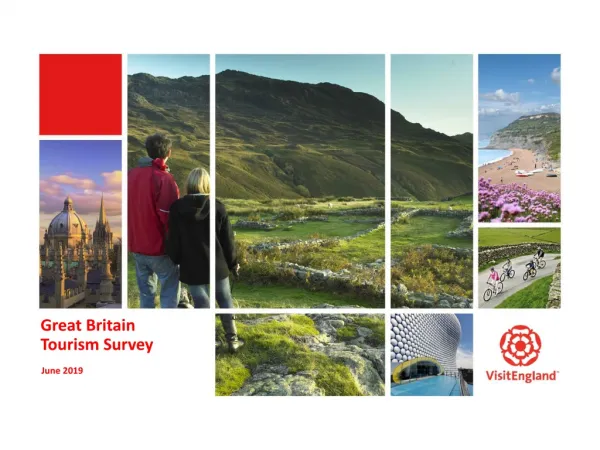
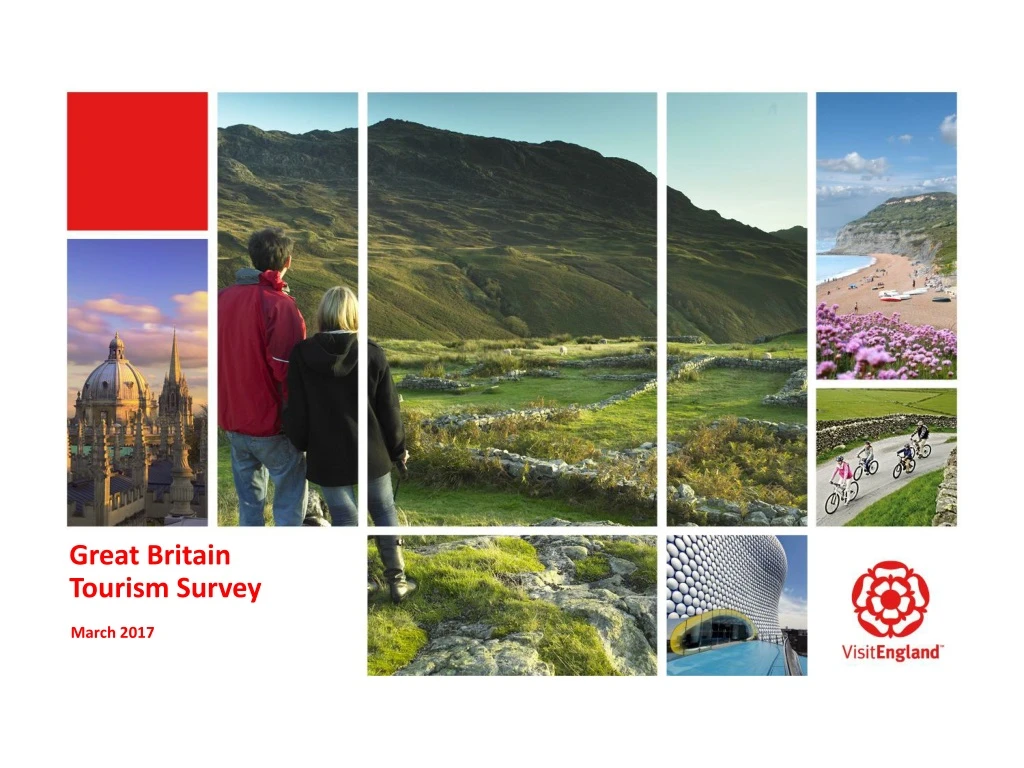
Great Britain Tourism Survey March 2017
Summary of Results GB And England Trips Nights -14% -25% -14% -8% -23% -13% -10% -15% Weather
Summary of Results England -5% -10% -10% -15% -5% +6% -7% -16% +3% • 16-24 • 55+ • Class C1 -4% -1% • North West • Yorkshire • Large City -4%
Context Other Surveys +5% +13% +3% +8% +1% +2% 0% -4% -3%
Headline Data GB and England • Volume and spend (2016 vs 2017) a a 2016 2016 England GB 2017 2017 • % change vs 2016
Trips England • Volume of trips (millions) (2016 vs 2017) 2016 2016 2016 2016 2017 2017 2017 2017 a a a a a a a a Holiday trips Business trips VFR trips All trips % change vs 2016
Nights England • Volume of nights (millions) (2016 vs 2017) 2016 2016 2016 2016 2017 2017 2017 2017 a a a a a a a a Holiday trips Business trips VFR trips All trips • % change vs 2016
Long Term Trends by Month GB • 2006-2017(millions)
Long Term Trends, Year-to-YearEngland All Trips Holiday Trips Business Trips VFR Trips
Rolling 12 Month TrendlinesEngland • All trips and spend
Rolling 12 Month TrendlinesEngland • Trips by purpose (millions) Holiday trips Business trips VFR trips
Regional Analysis England • Trip characteristics – region (YTD 2016 vs YTD 2017) Trips (Millions) Nights (Millions)
UK Outbound Travel (International Passenger Survey) • Total volume (millions) and spend (£bn) 2016 2016 2017 2017 a a a a Trips Spend • % change vs 2016
Appendix: Domestic Tourism England • Trip characteristics (Year-To-Date: Jan-March 2017) % change vs 2016
Appendix: Domestic Tourism England • Trip characteristics (Year-To-Date: Jan-March 2017) • % change vs 2016
Appendix: Domestic Tourism England • Trip characteristics (Year-To-Date: Jan-March 2017) • *caution small sample size % change vs 2016
Appendix: Domestic Tourism England • Year to date average trip length, spend/night, spend/trip
Note about these results: The GB Tourism Survey is a survey of British residents, in which 2000 respondents are interviewed each week, making a total of 100,000 each year. Any respondent having taken one or more overnight trips in the previous 4 week period is asked to describe the details of trips taken. Each year, data from around 17,000 trips is collected, and this is subsequently grossed up to provide population estimates. Full details of the survey methodology can be found at: https://www.visitbritain.org/archive-great-britain-tourism-survey-overnight-data On an annual basis, the survey is extremely robust, with a confidence level for England data at +/- 3% at the 95% level for the number of trips and nights measured, and +/- 4% for the expenditure figure. For shorter time periods and for other subsets of the data such as region or trip purpose, the margin of error is wider – guidance on confidence intervals at national and regional level for annual and quarterly data is provided on the next page. For any questions about data interpretation, please contact VEResearch@visitengland.org No part of this publication may be reproduced for commercial purposes without the permission of VisitEngland. Extracts may be quoted if the source is acknowledged. Users wishing to include results from this survey within a press release should contact Charlotte Sanders in the VisitEngland Press Office charlotte.sanders@visitengland.org for review prior to external release.
GB Domestic Tourism: Confidence Limits at the 95% level Based on Quarter 1