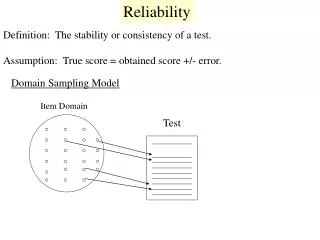
RELIABILITY
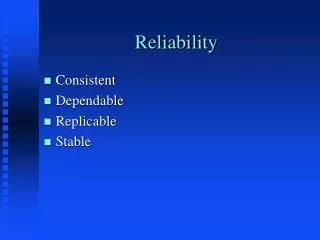
RELIABILITY. Reliability refers to the consistency of a test or measurement. Reliability studies Test-retest reliability Equipment and/or procedures Intra- or inter-rater reliability Assessing the reliability of individual raters or a group of raters. Terminology. Reliability Consistency

RELIABILITY
E N D
Presentation Transcript
RELIABILITY • Reliability refers to the consistency of a test or measurement. • Reliability studies • Test-retest reliability • Equipment and/or procedures • Intra- or inter-rater reliability • Assessing the reliability of individual raters or a group of raters
Terminology • Reliability • Consistency • Precision • Repeatability • Agreement • “Reliability” and “agreement” are not synonymous!
Quantification of Reliability • In terms of “consistency” of measurements: • Relative consistency • The consistency of the position or rank of individuals in the group relative to others. • Quantified by the “intraclass correlation coefficient” (ICC) • Absolute consistency • An indication of the “precision” of a score • Allows for constructing confidence intervals about a score • Quantified by the “standard error of measurement” (SEM) or variations thereof • Minimum difference, standard error of prediction (SEP), etc.
Other Procedures Used to Quantify Reliability • Pearson Product Moment correlation (Pearson r) • Cannot detect systematic error • The coefficient of variation • Standard deviation ÷ mean • Limits of agreement (Bland-Altman plots) • Bland-Altman plots compare two measurement techniques on the same variable • Example: • DEXA vs. UWW for body composition
Reliability Theory • Each observed score is composed of two parts: • True score • The mean of an infinite number of scores from a subject • Error • True score – observed score = error • Sources of error: • Biological variability, instrumentation, error by the subject, error by the tester, etc. • Similarly, for a group of scores, the total variance (σ2T) in the data has two components: • True score variance (σ2t) • Error variance (σ2e)
Reliability Theory • Therefore: • If we make a ratio of the true score variance (σ2t) to the total variance (σ2T) we have a reliability coefficient defined as:
Reliability Theory • The closer to 1.0, the higher the reliability • Problem… • We don’t actually know the “true score” for each subject; therefore, we don’t know the “true score variability.” • We use an index for true score variability (σ2t) based on between-subjects variability; therefore, the formal definition of reliability becomes…
Variance Estimates • Variance estimates are derived from the single-factor, within-subjects ANOVA model • Appropriate mean square values (MS) are recorded from the ANOVA table • NOTE: These will be the values we use to calculate the ICCs
Intraclass Correlation Coefficients • ICC is a relative measure • Ratio of variances from ANOVA • Unitless • More like to R2 from regression, than the Pearson R • 1 = perfect reliability; 0 = no reliability • The relative nature of the ICC and the magnitude of the ICC is dependent on the between-subjects variability • ↑ between-subjects variability = ↑ ICC • ↓ between-subjects variability = ↓ ICC • Therefore, ICCs are context-specific • “There is literally no such thing as the reliability of a test, unqualified; the coefficient has meaning only when applied to specific populations” Streiner & Norman (1995).
Error • Two types of error • Systematic error • Random error • Where: systematic error + random error = total error
ERROR Systematic Error Random Error Examples: Luck, alertness, attentiveness by tester, normal biological variability Constant Error Bias Affects all scores equally (examples) Learning effects Fatigue during the test Affects certain scores different from others These random errors should both increase and decrease scores randomly
Systematic Error • It is argued that systematic error deals with VALIDITY not RELIABILITY! • Systematic error is a “natural phenomenon” that does not contribute to unreliability per se • Should we include systematic error?
Calculations of Reliability • We are interested in calculating the ICC • First step: • Conduct a single-factor, within-subjects (repeated measures) ANOVA • This is an inferential test for systematic error • All subsequent equations are derived from the ANOVA table • NOTE: Both one-way and two-way ICC models can be completed from the same single-factor, within-subjects ANOVA
ANOVA Table • 3 sources of variability • Subjects (MSB) or (MSS) • Between-subjects variability (for calculating the ICC) • Trials (MST) • Systematic error (for calculating the ICC) • Error (MSE) • Random error (for calculating the ICC) • 2 factors • Trials • Differences between trials • Subjects • Differences between subjects • Interaction term = trials x subjects
ANOVA Table • 2 reasons for noting the three different sources of variability • As we will see, there are 6 different ICC models • Two are “one-way models” and four are “two-way models” • One-way models lump together the “trial” and “error” variability • Two-way models keep them separate • Between-subjects ANOVAs are different than within-subjects ANOVAs • The variability due to subjects is not accounted for in the within-subjects ANOVA (due to the repeated testing of the same subject, we assume the same between-subjects variability)
ICC Models • Shrout & Fleiss (1979) have developed 6 forms of the ICC: • There are 3 general models: • Models 1, 2, and 3 • Each can be calculated two different ways • If the individual scores are actually “single” scores from each subject for each trial, the ICC model is given a second designation of “1” • If the scores in the analysis represent the average of “k” scores from each subject, the ICC is given a second designation of “k”
ICC Models • Usually presented in the context of determining rater reliability • Model 1 (1,1 & 1,k) • Each subject is assumed to be assessed by a different set of raters than other subjects • Random effect of raters • Model 2 (2,1 & 2,k) • Each subject is assumed to be assessed by the same group of raters, and these raters were randomly sampled • Still random effect of raters
ICC Models • Model 3 (3,1 & 3,k) • Each subject is assessed by the same group of raters, but these raters are the only ones of interest • No desire to generalize the ICCs calculated beyond the confines of the study or laboratory • Does not include systematic error in the model
Example • Using Model 3,1 • Test-retest reliability • No desire to generalize to other devices or testers • Systematic error is not accounted for, but we conduct an ANOVA to test for systematic error • This receives the same criticism as the Pearson R for not accounting for systematic error
Interpreting the ICC • If ICC = 0.95 • 95% of the observed score variance is due to true score variance • 5% of the observed score variance is due to error • 2 factors for examining the magnitude of the ICC • Which version of the ICC was used? • Magnitude of the ICC depends on the between-subjects variability in the data • Because of the relationship between the ICC magnitude and between-subjects variability, standard error of measurement values (SEM) should be included with the ICC
Implications of a Low ICC • Low reliability • Real differences • Argument to include SEM values • Type I vs. Type II error • Type I error is rejecting H0 when there was no effect (i.e., H0 = 0) • Type II error is failing to reject the H0 when there is an effect (i.e., H0≠ 0) • A low ICC means that more subjects will be necessary to overcome the increased percentage of the observed score variance due to error.
Standard Error of Measurement • ICC relative measure of reliability • No units • SEM absolute index of reliability • Same units as the measurement of interest • Usually used to construct confidence intervals • The SEM is the standard error in estimating observed scores from true scores.
Calculating the SEM • 2 basic ways to calculate SEM • #1
Calculating the SEM • 2 basic ways to calculate SEM • #2
SEM • We can report SEM values in addition to the ICC values and the results of the ANOVA • We can calculate the minimum difference (MD) that can be considered “real” between scores • We can also construct 95% confidence intervals about a subject’s estimated true score based on the SEM or SEP.
Minimum Difference • The SEM can be used to determine the minimum difference (MD) to be considered “real” and can be calculated as follows:
Confidence Intervals • First we must estimate the subjects true score (T): • X = grand mean • S = observed score
Confidence Intervals • Second, we must determine the standard error of prediction (SEP): • SD = standard deviation • ICC = intraclass correlation coefficient
Confidence Intervals • Third, we can calculate the confidence intervals as: