Reliability
Reliability. Reliability. Introduction to Reliability Historical Perspective Current Devices Trends. Failure rate, . Infant Mortality. Useful life. Wear out. Constant. Time. The Bathtub Curve. Introduction to Reliability. Failure in time (FIT) Failures per 10 9 hours


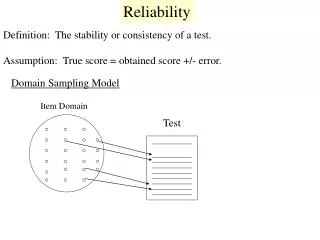
Reliability
E N D
Presentation Transcript
Reliability • Introduction to Reliability • Historical Perspective • Current Devices • Trends
Failure rate, Infant Mortality Useful life Wear out Constant Time The Bathtub Curve
Introduction to Reliability • Failure in time (FIT) Failures per 109 hours ( ~ 104 hours/year ) • Acceleration Factors • Temperature • Voltage
EA/kT ttf = C • e Introduction to Reliability (cont'd) Most failure mechanisms can be modeled using the Arrhenius equation. ttf - time to failure (hours) C - constant (hours) EA - activation energy (eV) k - Boltzman's constant (8.616 x 10⁻⁵eV/°K) T - temperature (ºK)
Integrated Circuit ReliabilityHistorical Perspective Application Reliability • Apollo Guidance Computer < 10 FITs • Commercial (1971) 500 Hours • Military (1971) 2,000 Hours • High Reliability (1971) 10,000 Hours • SSI/MSI/PROM 38510 (1976) 44-344 FITs • MSI/LSI CICD Hi-Rel (1987) 43 FITs
Actel FPGAs Technology FITS # Failures Device-Hours (m) 2.0/1.2 33 2 9.4 x 10⁷ 1.0 9.0 6 6.1 x 10⁸ 0.8 10.9 1 1.9 x 10⁸ 0.6 4.9 0 1.9 x 10⁸ 0.45 12.6 0 7.3 x 10⁷ 0.35 19.3 0 4.8 x 107 RTSX 0.6 33.7 0 2.7 x 10⁷ 0.25 88.9 0 1.0 x 10⁷ 0.22 78.6 0 1.2 x 10⁷
Xilinx FPGAs • XC40xxXL • Static: 9 FIT, 60% UCL • Dynamic: 29 FIT, 60% UCL • XCVxxx • Static: 34 FIT, 60% UCL • Dynamic: 443 FIT, 60% UCL
UTMC and Quicklogic • FPGA • < 10 FITS (planned) • Quicklogic reports 12 FIT, 60% UCL • UT22VP10 UTER Technology, 0 failures, 0.3 [double check] • Antifuse PROM • 64K: 19 FIT, 60% UCL • 256K: 76 FIT, 60% UCL