Download
1 / 14
140 likes | 287 Views
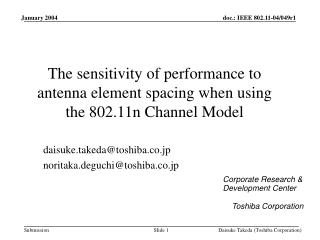
The sensitivity of performance to antenna element spacing when using the 802.11n Channel Model. daisuke.takeda@toshiba.co.jp noritaka.deguchi@toshiba.co.jp. Corporate Research & Development Center Toshiba Corporation. Objective. 802.11n channel model

E N D
The sensitivity of performance to antenna element spacing when using the 802.11n Channel Model daisuke.takeda@toshiba.co.jp noritaka.deguchi@toshiba.co.jp Corporate Research & Development Center Toshiba Corporation Toshiba Corporation
Objective • 802.11n channel model • Uniform linear array is mentioned in doc-940r1. D=2pd / l ( d: Antenna spacing, l: Wavelength ) • In doc-940r1, angular spread is defined for each channel model. • The minimum AS is less than 15 degree (Model B, 1st-cluster). • The maximum AS is more than 50 degree (Model F, 2nd-cluster). • Matlab channel model assumes 0.5l astypical example. (1) Toshiba Corporation
Objective (cont’d) • Small AS case • Antenna distance is critical issue. (especially when antenna spacing d is small) d d • Large AS case • Antenna distance is not so critical. • SpatialCorrelation • Spatial correlation is governed by Bessel Function. • AS affects spatial correlation. (may not be pure Bessel Function) r J0(2p d/l) d How much does antenna spacing affect PER performance? Toshiba Corporation
Simulation Parameters Table 1 Simulation Parameters Toshiba Corporation
Fig.1 Channel Model B (LOS) Toshiba Corporation
Fig.2 Channel Model D (LOS) Toshiba Corporation
Table 2 • Performance Difference from 0.5l in Model B [dB] • at a PER of 10-2 0dB – 2dB 2dB – 4dB > 4dB • Table 3 • Performance Difference from 0.5l in Model C [dB] • at a PER of 10-2 Toshiba Corporation
Table 4 • Performance Difference from 0.5l in Model D [dB] • at a PER of 10-2 0dB – 2dB 2dB – 4dB > 4dB • Table 5 • Performance Difference from 0.5l in Model E [dB] • at a PER of 10-2 --- We have not got yet Toshiba Corporation
From Simulation Results • The performance difference is serious for Model B. • Due to Narrow AS. • The performance difference for 0.5l and 1.0l spacing is 6dB at a PER of 10-2. ( 54Mbps, 3x3 case ). • Performance differences increase with the number of antennas. • The difference increases with data rate. (54Mbps experiences large differences). • In 54Mbps, Throughput performance will be seriously affected. Toshiba Corporation
Conclusions • Performance varies appreciably with antenna spacing. • It depends on channel models, data rate and number of antennas. • The difference between 0.5l and 1.0l shows 6dB. • The comparison criteria must specify antenna separation. • A fair comparison of proposals can only occur if the same antenna geometry and spacing are employed by everyone. • Hence, these parameters should be specified in the Comparison Criteria document for both the transmitter and receiver. Toshiba Corporation
End Toshiba Corporation
Fig.3 Channel Model C (LOS) Toshiba Corporation
Fig.4 Channel Model E (LOS) Toshiba Corporation
Spatial Correlation for Model B, Tap #3 Toshiba Corporation