Download
1 / 23
230 likes | 358 Views
Observation of a Saharan dust outbreak on 1-2 August 2007: determination of microphysical particle parameters Paolo Di Girolamo 1 , Donato Summa 1 , Rohini Bhawar 1 , Tatiana Di Iorio 2 , Marco Cacciani 2 , Igor Veselovskii 3 , Alexey Kolgotin 3.

E N D
Observation of a Saharan dust outbreak on 1-2 August 2007: determination of microphysical particle parameters Paolo Di Girolamo1, Donato Summa1, Rohini Bhawar1, Tatiana Di Iorio2, Marco Cacciani2, Igor Veselovskii3, Alexey Kolgotin3 1 DIFA, Università degli Studi della Basilicata, Potenza, Italy, 2 Dipartimento di Fisica, Università degli Studi di Roma “La Sapienza”, Roma, Italy 3 Physics Instrumentation Center, Troitsk, Moscow Region, Russia 6th COPS Workshop, 27 – 29 February 2008 University of Hohenheim, Stuttgart
BASIL Particle Backscatter Ratio at 1064 nm, 1-2 August 2007 12000 10000 8000 ALTITUDE A.G.L. (m) 6000 4000 2000 0 02 10 12 14 16 18 20 22 8 0 TIME (UTC)
Water Vapour Mixing Ratio 1-2 August 2007 12000 g/Kg 9600 12 out-flow boundary 7200 ALTITUDE A.G.L. (m) 3.6 4800 0 2400 0 18:45 03:16 TIME (UTC)
BASIL Raman Lidar • Measured parameters: • particle backscattering coeff. @ 355, 532 and 1064 nm 3b • particle extinction coeff. @ 355 and 532 nm2a • depolarization ratio @ 355 & 532nm, • atmospheric temperature • water vapour mixing ratio • relative humidity from simultaneous measurements of temperature and water vapor mixing ratio particle size and microphysicalparameters COPS Web Page http://www.cops2007.de/ Operational Products Raman lidar measurements (25 May – 30 August 2007) More than 500 hoursof measurements distributed over 58 days
Particle size distribution parameters: Mean radius rmean Effective radius reff Number concentration N Surface concentration S Volume concentration V Complex refractive index mrand mi Parameters of a bimodal size distribution Inversion algorithm 3b+2a The retrieval scheme employs Tikhonov’s inversion with regularization Algorithm developed at the Physics Instrumentation Center Veselovskii et al., Appl. Opt. 41, 3685–3699, 2002. In the solution of the inverse problem, particle size distributionf(r) is approximated by the superposition of base functionsBj(r) as: where cj(z) are the weight coefficients. Base functions have a triangular shape on a logarithmic-equidistant grid
Inversion with regularization rmin=0.05 mm, rmax=15 mm 1.3 <mr< 1.6 0<mi<0.04 Mean radius rmean Effective radius reff Number concentration N Surface concentration S Volume concentration V f(r) numerically integrating f(r) over the radius interval [rmin, rmax]
Particle Backscatter Ratio at 1064 nm, 1-2 August 2007 12000 10000 8000 ALTITUDE A.G.L. (m) 6000 4000 2000 0 02 10 12 14 16 18 20 22 8 0 TIME (UTC) Focus: two specific times when aerosol loading was higher 21:00-21:30 UTC on 1 August 2007 00:00-00:30 UTC on 2 August 2007 (red dashed lines in figure)
1 August 2007,21:00-21:30 UTC 2 August 2007,00:00-00:30 UTC averaging layers 1710-2100 m 2100-2490 m 2490-2910 m 2910-3210 m 3690-4110 m 4110-4500 m 4500-4920 m 5310-5700 m 400 m thick
1 August 2007,21:00-21:30 UTC 2 August 2007,00:00-00:30 UTC Particle size distribution fine mode: 0.15-0.25 mm Particle size distribution coarse mode: 1-4 mm 0.1 mm <rmean< 0.2 mm, 0.1 mm <reff< 1.0 mm 5 mm3/cm3 <V< 40 mm3/cm3
1 August 2007,21:00-21:30 UTC 1.44 <mr< 1.53 0.003 <mi< 0.008 Method: Inversion with regularization, performed by generalized cross-validation. In this retrieval, the combination of particle extinction and backscatter coefficients becomes especially important. The number of backscatter coefficients in the retrieval procedure should exceed the number of extinction coefficients by a factor of 2–3.
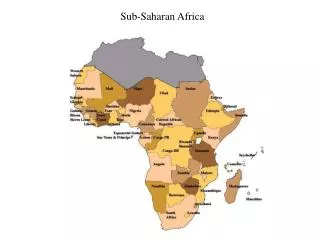
Backward trajectories ending at 00:00 UTC on 2 August 2007 The air masses observed in Achern in the altitude region 3.5-5 km a.g.l. originated in the mixed layer over the Saharan desert NOAA-ARL HYSPLIT Lagrangian trajectory model
Dust particle hygroscopicity 1-2 August 2007 Particle Backscattering coefficient at 355nm (log scale) 10000 8000 6000 ALTITUDE A.G.L. (m) 3-5.5 km 4000 2000 0 21:30 22:00-23:00 23:22 01:15 TIME (UTC)
1-2 August 2007 Relative Humidity 10000 8000 6000 6000 ALTITUDE A.G.L. (m) 3-5.5 km 4000 4000 2000 2000 0 0 21:30 21:30 22:00-23:00 23:22 01:15 TIME (UTC)
Particle backsc. coeff. at 355 nm vs RH, 1 August 07, 22:00-23:00 UTC, Dt=2min, 3-5.5 km 3.2x10⁻⁶ Particle back 355 nm [m-1 sr-1] 1.6x10⁻⁶ 0 0 25 50 75 100 RH [%] Substantial increase in particle backscattering when RH > 75 % Swelling tendency of hygroscopic aerosol particles at large RH values Trend compatible with partially soluble aerosol particles Back-trajectories show that airmasses originated in the Saharan desert transited for several days over the Atlantic Ocean Aged dust particles presumably mixed with maritime aerosol during the advection to the meaurement site and partially coated with hygroscopic material
BASIL Raman Lidar University of Manchester Radio Wind Profiler, 1290 MHz UHF Doppler radar MIRA 36, Linear Depolarizatio Ratio radar bright band freezing level lidar dark band freezing level radar bright band freezing level MIRA 36, Radar Reflectvity at 36 GHz radar bright band freezing level 4000 ALTITUDE (m) 9 m/s 4.5 m/s radar bright band freezing level
IOP 9c – 20 July 07 Passage of the frontal zone, with a Mesoscale Convective System inbedded Shear 10:46 11:37 8000 Range corrected signals at 1064 nm 6400 4800 ALTITUDE A.G.L. (m) 3200 THUNDERSTORM 1600 0 TIME (UTC) The waves like structures seen in the data just prior to the arrival of thethunderstorm are due to shear between inflow and outflow regions.
BASIL – Rhine Valley Supersite (Lat: 48.64 ° N, Long: 8.06 E, Elev.: 140 m) 25-26 July 2007 – Water vapour mixing ratio g/kg 1 Height a.s.l. (m) 0 21:00 00:30 04:00 mixing ratio (g/kg) TIME (UTC) DT = 5 min, Dz = 150 m
Range corrected signals at 1064 nm Water vapour mixing ratio 10:46 11:37 10:46 11:37
b1064 b532 b355 a355 a532
1-D approach 2-D approach