Download
1 / 23
230 likes | 323 Views
ASN data recording in the 2010 pupil Census. Changes to ASN recording in the 2010 Pupil Census. Method of recording Need types and reasons for support changed Now pupils have reasons for support associated with each need type.

E N D
Changes to ASN recording in the 2010 Pupil Census • Method of recording Need types and reasons for support changed • Now pupils have reasons for support associated with each need type. • Multiple reasons for support and need types were recorded previously, but the two were not linked • New code for ‘Other need type’ added.
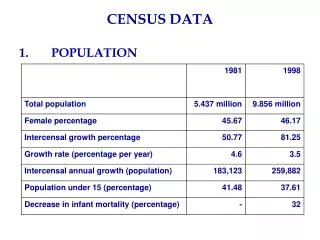
Effects of this change • Large increase in the number of pupils recorded with ASN (from 44,176 in 2009 to 69,587 in 2010), largely as a result of recording information on pupils with ‘other need’ types for the first time. • More complete information on pupils with ASN as required by the 2009 ASL Act • Under-recording of information on pupils with disabilities in most local authorities.
Increase in pupils with ASN • In 2010, 25,657 pupils were recorded as having an ‘Other Need’, the vast majority of these (23,670) do not have a CSP or IEP recorded. • If we only include pupils in special schools and those with a CSP or IEP, the actual increase is just 5% from 44,176 in 2009 to 46,502 in 2010. • Another result of the inclusion of ‘Other Needs’, were large increases to all reason for support categories apart from deafblind. The largest increase (over 5,000) was in Social, emotional and behaviour difficulties.
Pupils recorded as disabled • In 2010, the number of pupils recorded as assessed disabled decreased by 44%, but; • 3 local authorities increased the number of pupils assessed as disabled • 16 local authorities decreased the number of pupils assessed as disabled by more than 50 % • In 2010, the number of pupils recorded as declared disabled decreased by 19%,
What can we do to improve the disability data for 2011? • Scottish Government can supply data to each local authority on which pupils were recorded as assessed or declared disabled in each school in 2009. • Local Authorities and schools can then use this data to check their records and update their systems prior to the 2011 census.
Discussion • What data would you like us to supply in order to assist you in updating your systems? • Any advice on how to update this information from those local authorities who did not under-record disabilities or who have already followed up on this problem? • Similar issues may occur in 2011 when the new ‘Child Plan’ need type is introduced. How do we prevent this?
Background • In September 2010 we consulted on the collection and publication of school education statistics • The consultation proposed that: • The collection and publication of a number of statistics would cease. • The attendance and absence collection would be collected and published biennially • Publications be combined into 3 summary ones in February, June and December
Results of consultation • 5 collections/publications discontinued • Children Educated outwith schools • Placing requests • Teacher and Educational Psychologists Vacancies • Expenditure on schools • Independent School Census • School Meals collection retained • Summary compendium publications introduced • All other changes are subject to the amendment of the school handbooks legislation, These are: • Attendance and absence and exclusions going biennial • BSRC collection and SQA pre-appeal qualifications publication ceased
A consultation on the content of the School Handbook finished on 14 March • The responses from this are currently being analysed but any changes to legislation will need to wait until the new Ministers are in place • In the mean time we are still planning to collect this data this year.
Compendium publications • The first compendium publication ‘Summary Statistics for Schools in Scotland’ was published in December 2010. • Covers: Pupils, teachers, attendance and absence, exclusions and pre-schools. In 2011 will also include school estates • Only a few summary tables in the main publication but detail published in supplementary data sets
The second publication will be published end June and will contain: • Information on SQA qualifications attained by school leavers • Destinations of leavers (initial and follow-up) • School Meals information • After the June publication we will consult with users on both compendia publications to seek their views on this new approach
School Meals Survey • The consultation proposed that this collection should be dropped. However: • Stakeholders responded that this information was essential and widely used. • So, survey retained but in a reduced form. • As a result of the late decision to retain this information, limited time was available to design the new form, so local authorities were not consulted. • The form design was complicated by the introduction of local initiatives and the government commitment not to monitor these
We decided to collect information on pupils registered for free school meals regardless of whether this was under local or national initiatives, because: • Some LAs reported problems recording FSM in the pupil census due to local initiatives. • Analysis of the pupil census data on FSM highlighted inconsistencies in P1-P3 in 2010. • If pupils were entitled to FSM under local initiatives they would be less likely to register under national criteria. • All of these pupils were able to receive free school meals so this would accurately record that • The agreement with COSLA not to monitor local initiatives
However, we recognise that this means that, in terms of a deprivation indicator, the data is inconsistent with previous years, so: • We will highlight this when the data is published in June. • Recommend that 2010 school meals data or SIMD is used instead when trying to identify deprived schools • A number of local authorities have expressed their concern over this change and the fact that they were not consulted first. • We apologise for this and will be consulting with local authorities in the summer on the content of the 2012 form • We anticipate that the local initiatives will not continue next year
Discussion • Is the website easy to use and can you find the information you need? • What do you think about the new publication design, is it easy to find the information you need in the data sets? • Any suggestions on how to improve the website, publications or supplementary datasets? • Any questions or comments you wish to make with regard to the school meals survey?
New June compendium publication Section on qualifications and leaver destinations
Summary details • Titled ‘Summary statistics for attainment, leaver destinations and school meals’ • Due to be published on 29 June 2011 • Links SQA qualification data to SDS school leaver destination data • New focus on attainment of leavers and linking this to destinations • All previously available tables will be available in supplementary data sets
Table 1. Average tariff score of school leavers by highest SCQF level at which 1 or more passes were achieved
Table 2. Average tariff score and percentage of school leavers by age and highest SCQF level at which 1 or more passes were achieved at ,2008/09.
Table 3. Average tariff score and percentage of school leavers by highest SCQF level at which 1 or more passes were achieved at and initial destination category, 2008/09.
Table 4. Percentage of school leavers by initial and follow up destination category , 2006/07 to 2008/09.