Download

1 / 24
0 likes | 19 Views
Observations from the Mt. Wilson Observatory's telescope reveal insights into the solar surface dynamics, particularly focusing on zonal and meridional flows, torsional oscillations, and rotation shear. By analyzing deviations in rotation rates and aligning with sunspot activity, key patterns and predictive indicators for solar cycle development are identified. The study also highlights the migration of flow patterns from poles to equator, with significant implications for understanding solar behavior.

E N D
Supported in part by NSF grant AGS-0958779 and NASA grant NNX09AB12G. Roger K. Ulrich Division of Astronomy and Astrophysics, Department of Physics and Astronomy, University of California at Los Angeles http://ulrich.astro.ucla.edu/SolarSurfaceDynamics.html

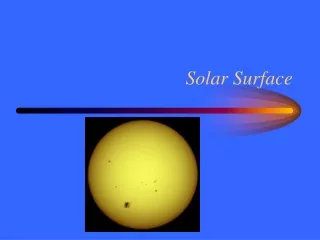
Observations of surface velocities from the Mt. Wilson Observatory 150-foot tower telescope. Use solar rotation to divide into N/S (meridional) flow and E/W (zonal) flow. These slides emphasize the zonal flow as manifested in the Torsional Oscillations.
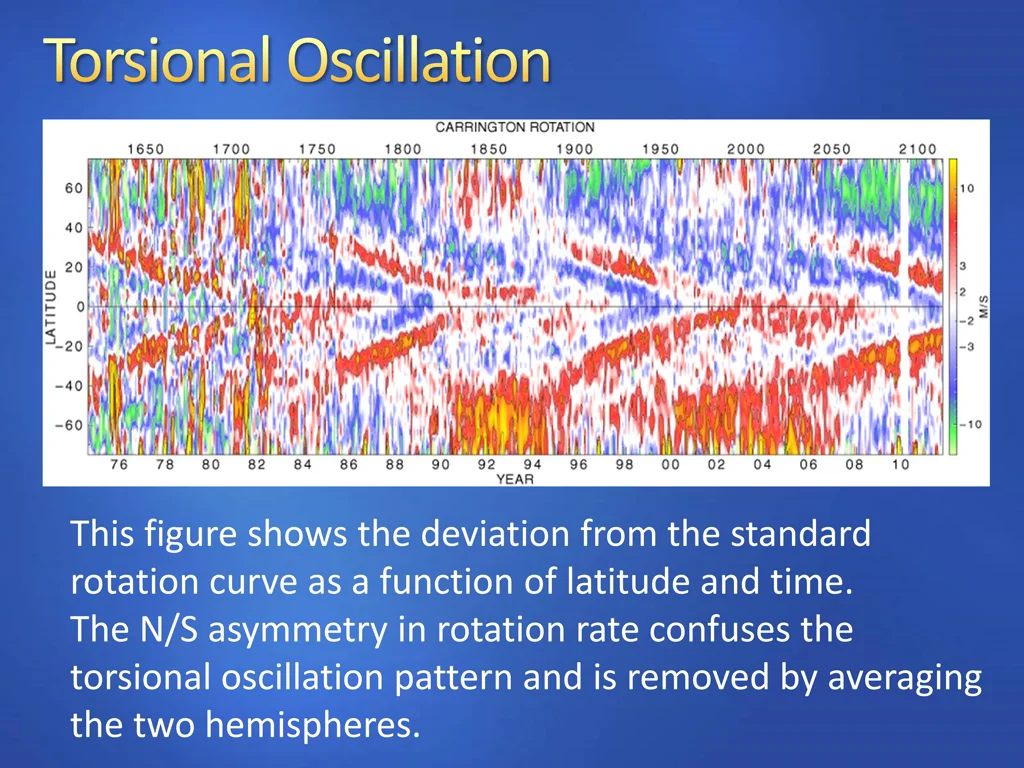
This figure shows the deviation from the standard rotation curve as a function of latitude and time. The N/S asymmetry in rotation rate confuses the torsional oscillation pattern and is removed by averaging the two hemispheres.
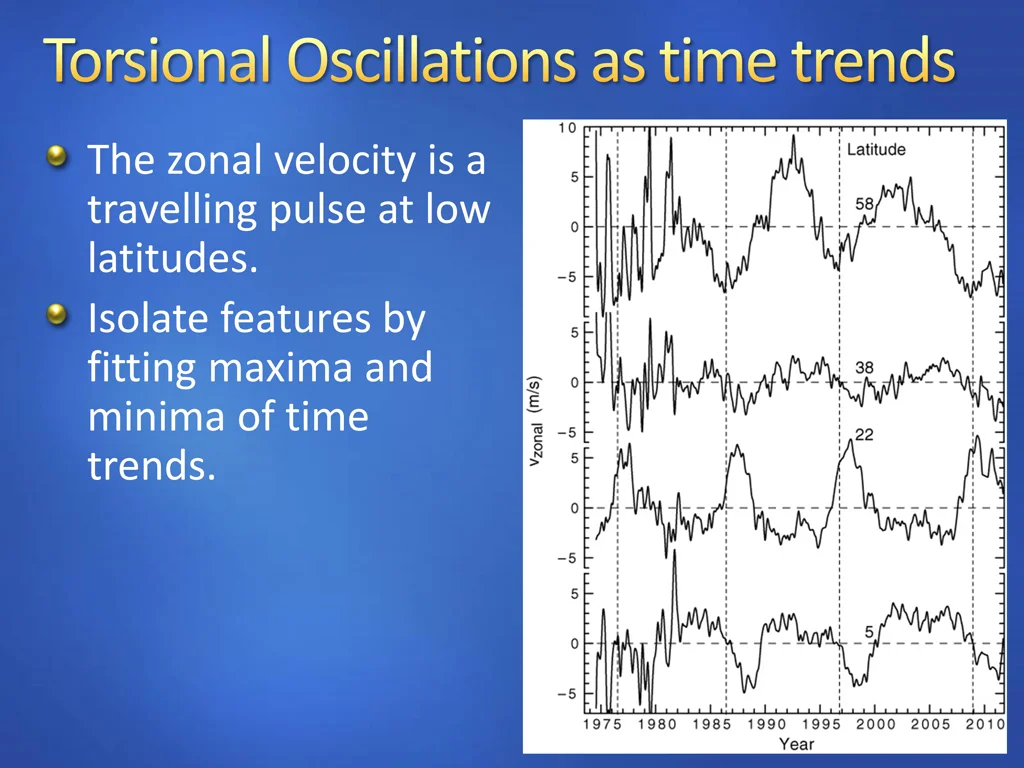
The zonal velocity is a travelling pulse at low latitudes. Isolate features by fitting maxima and minima of time trends.
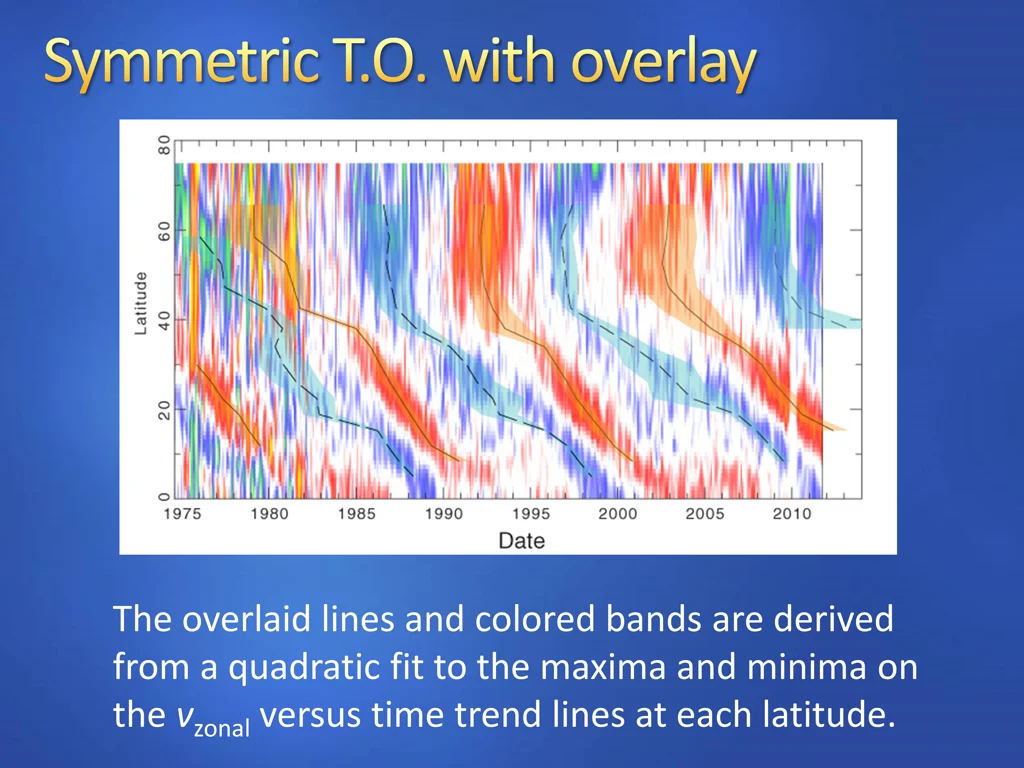
In this figure the north and south hemispheres have been averaged together and the reflected southern hemisphere is omitted..

The overlaid lines and colored bands are derived from a quadratic fit to the maxima and minima on the vzonalversus time trend lines at each latitude.
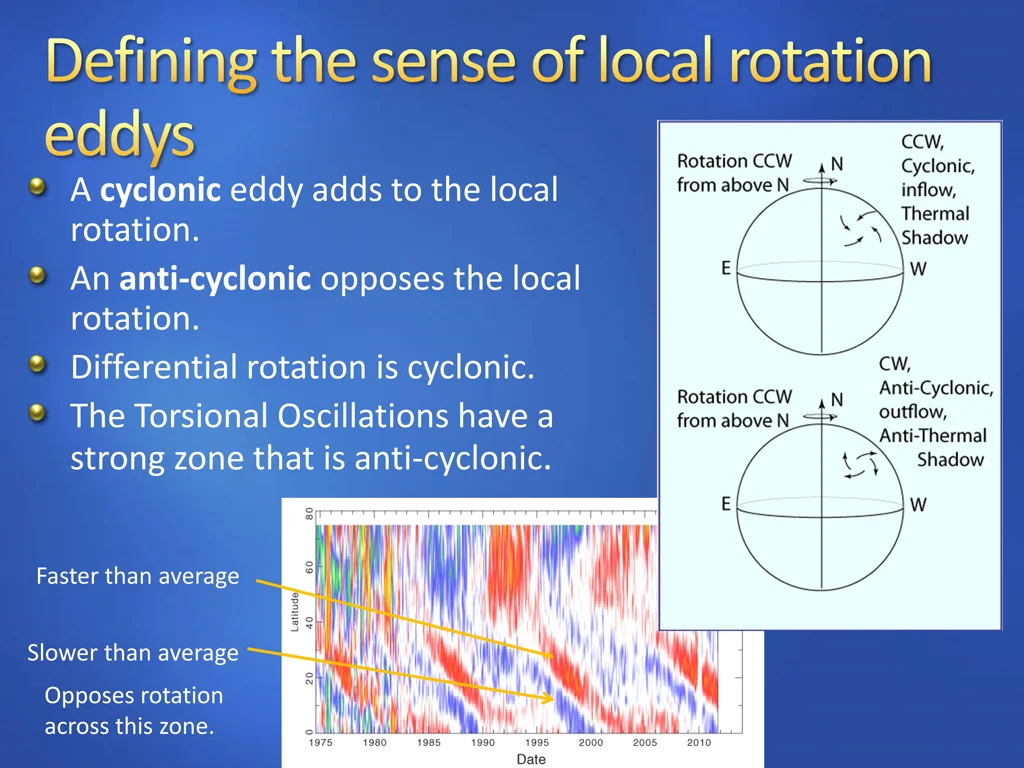
A cyclonic eddy adds to the local rotation. An anti-cyclonic opposes the local rotation. Differential rotation is cyclonic. The Torsional Oscillations have a strong zone that is anti-cyclonic. Faster than average Slower than average Opposes rotation across this zone.
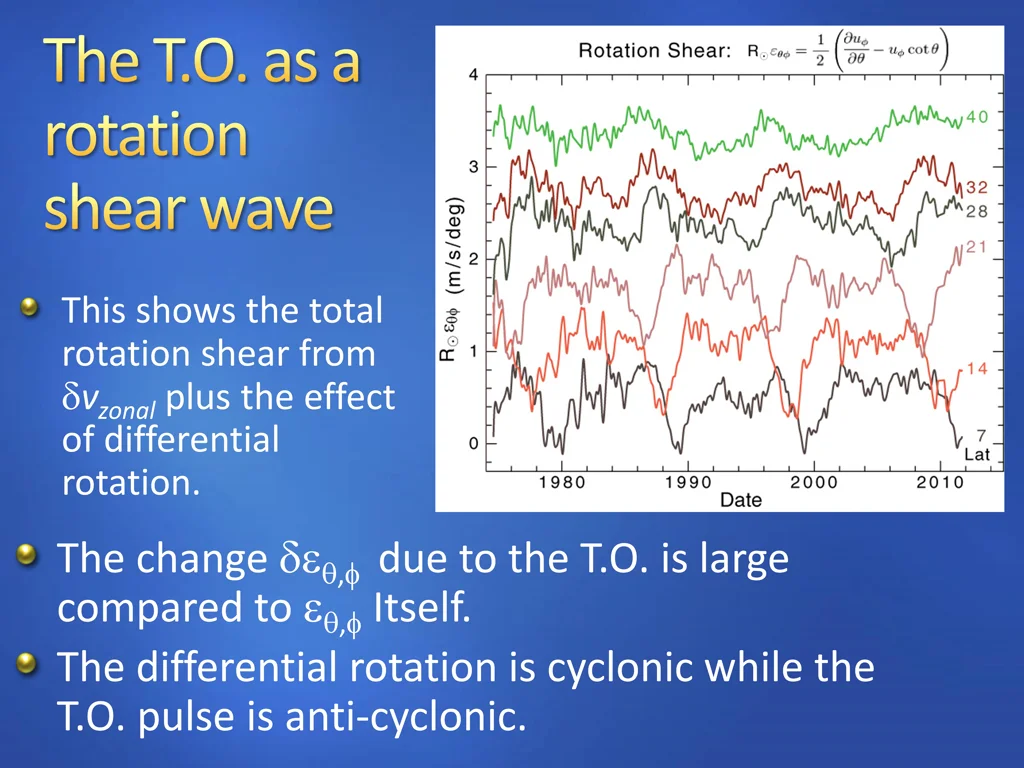
The strain rate tensor has a non-zero , component due to differential rotation. The Torsional Oscillations are a local time dependent change of this component: ,. The total strain rate is the sum of both contributions. By analogy with wind shear we call ,the rotation shear.

This shows the total rotation shear from vzonalplus the effect of differential rotation. The change ,due to the T.O. is large compared to ,Itself. The differential rotation is cyclonic while the T.O. pulse is anti-cyclonic.
This 2-D Plot shows the concentrated anti-cyclonic pulse which lasts about 18 months. The decrease in rotation shear is a substantial fraction of the background from differential rotation.

This figure compares the times and latitudes of sunspots to the propagation of the anti- cyclonic rotation pulse. All available cycles are combine using time relative to sunspot number minimum. The rotation shear scale is for the darkest parts to have = -0.6 and the lightest parts to have = 0.1. The sunspot locations are shown by Hathaway(2011) according to a system separating cycle strength and spot group size.

The position of the anti-cyclonic pulse is shown by the vertical bars. The curves show the deviation of the meridional circulation velocity from the overall average. Each circulation curve is the average of the N and S hemispheres. Dashed lines show where the deviation is zero. The anti-cyclonic pulse is partly aligned with the location of upwelling as indicated by the meridional circulation.

Solar minima based on the Torsional Oscillations were at 1976.4, 1986.7, 1996.9 and 2008.7. The Torsional Oscillation anti-cyclonic pulse drifts at a rate of 4.2 degrees/year toward the equator. Cycle 24 maximum is projected to occur at 2013.1±1. This projection will be updated at the end of 2011 and should have a reduced uncertainty.
Torsional oscillations are predictive of the solar cycle development. The Torsional oscillations are a propagating rotation shear pulse. Rotation shear drops then recovers in a space of 18 months. Activity appears about 18 months after the rotation shear recovers. Meridional flow indicating upwelling is partly aligned with the anti-cyclonic rotation shear pulse. The anti-cyclonic pulse suggests “anti-thermal shadowing”. A numerical representation of the pulse is available on the next slide which is included in the web site posting.
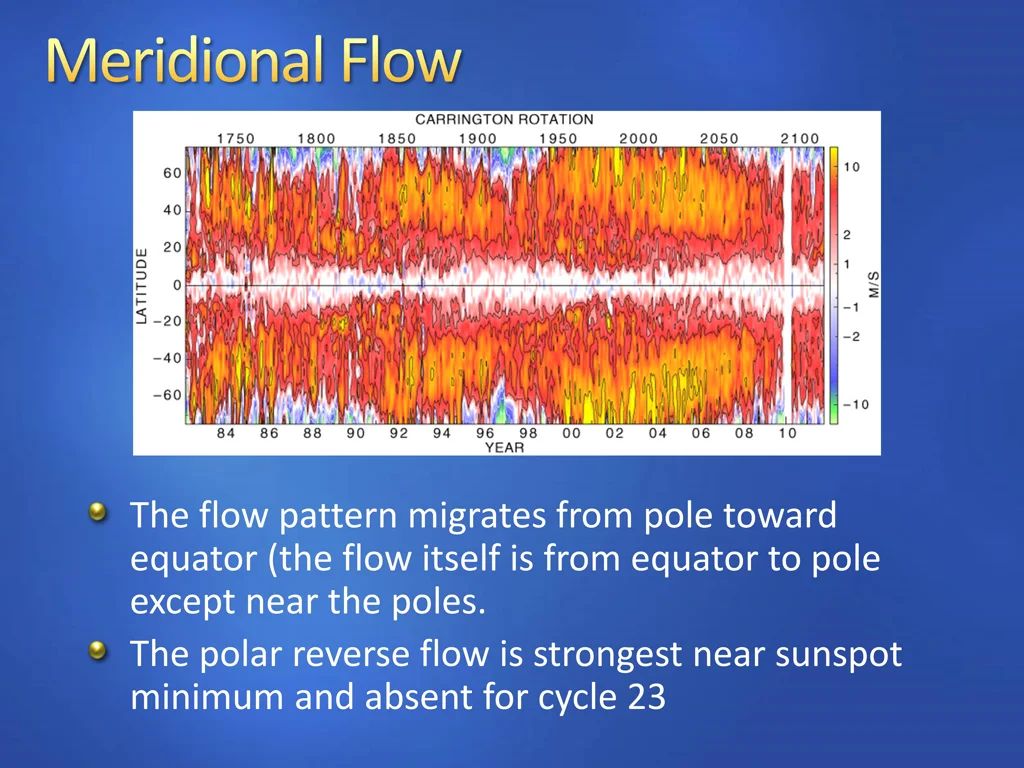
The flow pattern migrates from pole toward equator (the flow itself is from equator to pole except near the poles. The polar reverse flow is strongest near sunspot minimum and absent for cycle 23
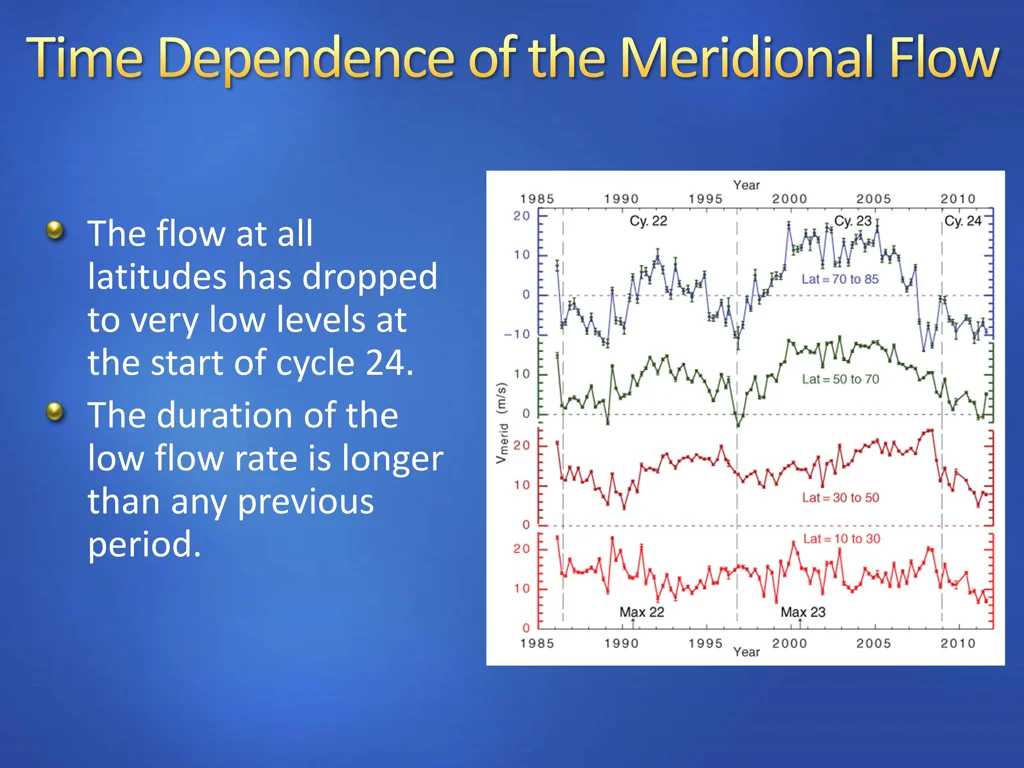
The flow at all latitudes has dropped to very low levels at the start of cycle 24. The duration of the low flow rate is longer than any previous period.
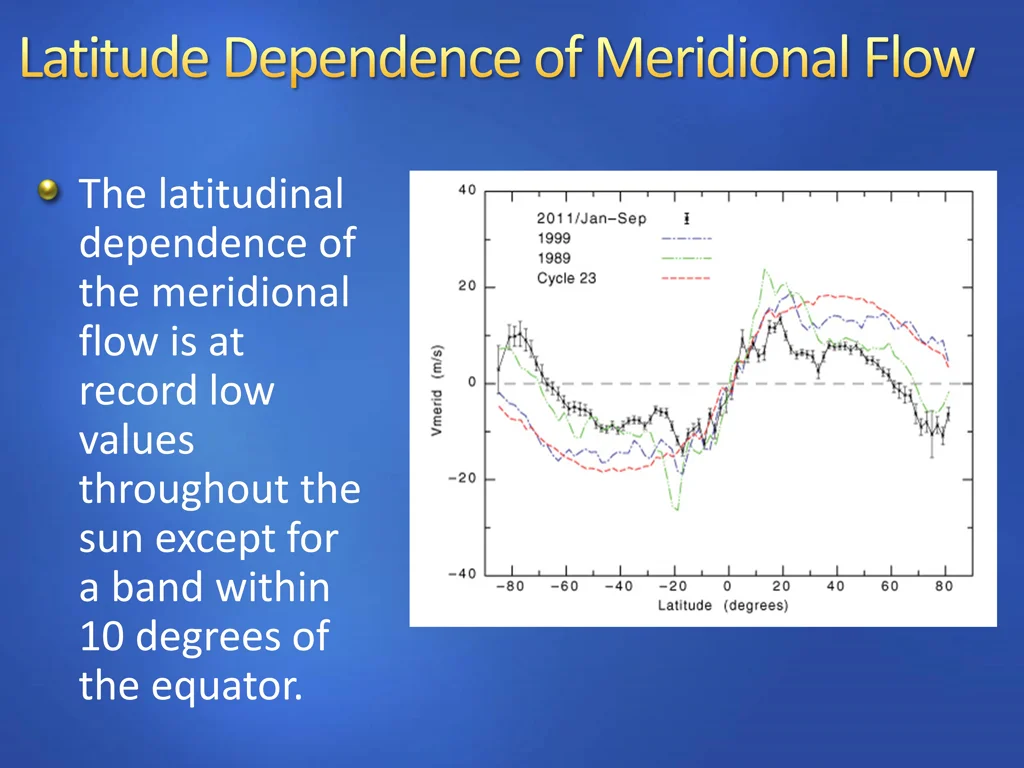
The latitudinal dependence of the meridional flow is at record low values throughout the sun except for a band within 10 degrees of the equator.
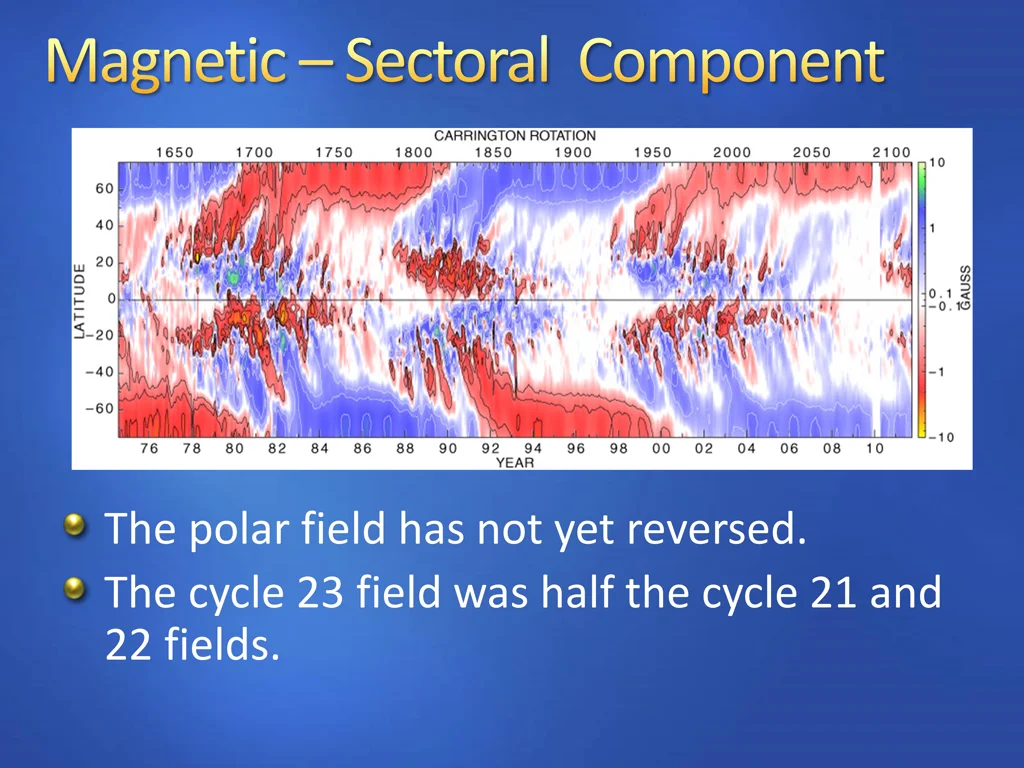
The polar field has not yet reversed. The cycle 23 field was half the cycle 21 and 22 fields.